RISC OS and GPS
A series of articles has been published in Archive Magazine describing the design and construction of a GPS receiver and speedometer:
- In part 1 (Archive 24:2) I described a Raspberry Pi that could be carried around: instead of a mouse and monitor it had an Adafruit touchscreen that just plugged in to the HDMI and USB sockets. It had a GPS module sending position data to the mapping application (RiscOSM) by means of URI_Dispatch messages generated by the !Satnav application. It thus provided a rolling map of your location using Open Street Map data.
- Part 2 (Archive 24:3) described version 1.08 of Satnav, which could control a small text display or an OLED display and could talk to RiscOSM using Wimp messages.
- Part 3 (Archive 24:4) adds a Witty Pi for control of power consumption. Satnav is at version 1.40 and can control an ‘electronic ink’ display (Papirus).
- Part 4 (Archive 24:5, expected November 2018) adds an Adafruit power-boost board to extend battery life, an Adafruit ADS1015 ADC board to provide battery management, improved odometer function, and adds software-controlled power-switching. GPX logging, rather than Anquet AEF format, internationalizes Satnav, now at version 1.80. At each stage the hardware has become smaller.
- Some of this information is available below.
Wakefield show 2018
See SatNav demonstrated at the Wakefield show - click here to see what will be at the show.
Initial development
I have seen only a very few items on the ROOL forum about linking a GPS module to RISC OS. The modules themselves are all fairly similar: they have a satellite receiver and just send a constant stream of data in a fairly standard format over a serial port.
Each satellite has an accurate clock (adjusted to keep Einstein happy) and is in an orbit at about 20km altitude circling the Earth twice a day. The satellite transmits a signal and a message giving time and location of transmission. The module observes the time differences between satellites in different parts of the sky (implying differences in distance) until it has sufficient information (usually from four satellites, up to ten of the 31 satellites may be in view at any time) to make a confident ‘fix’ of its own position.
My plan was to use a Raspberry Pi and so I chose a 'top hat' style board that could simply stack on top of the Pi. The Adafruit Ultimate GPS Hat was available from the Pi Hut for £39 and seemed to be suitable.
My bright idea had come to me on Tuesday evening (27th September 2016) so I ordered the GPS Hat and set about writing some software to receive GPS serial data and transmit it (in some way, not yet defined) to RISC OS.
I looked up the format of the serial data - plain text in the form of 'NMEA sentences'. I had a level-shifting serial adapter to connect to the Pi, via the 40-pin header, and I had a Compaq portable computer with a serial port (dating back to about 2002) and terminal software that I had used on a Beagleboard to make sense of the start up messages.
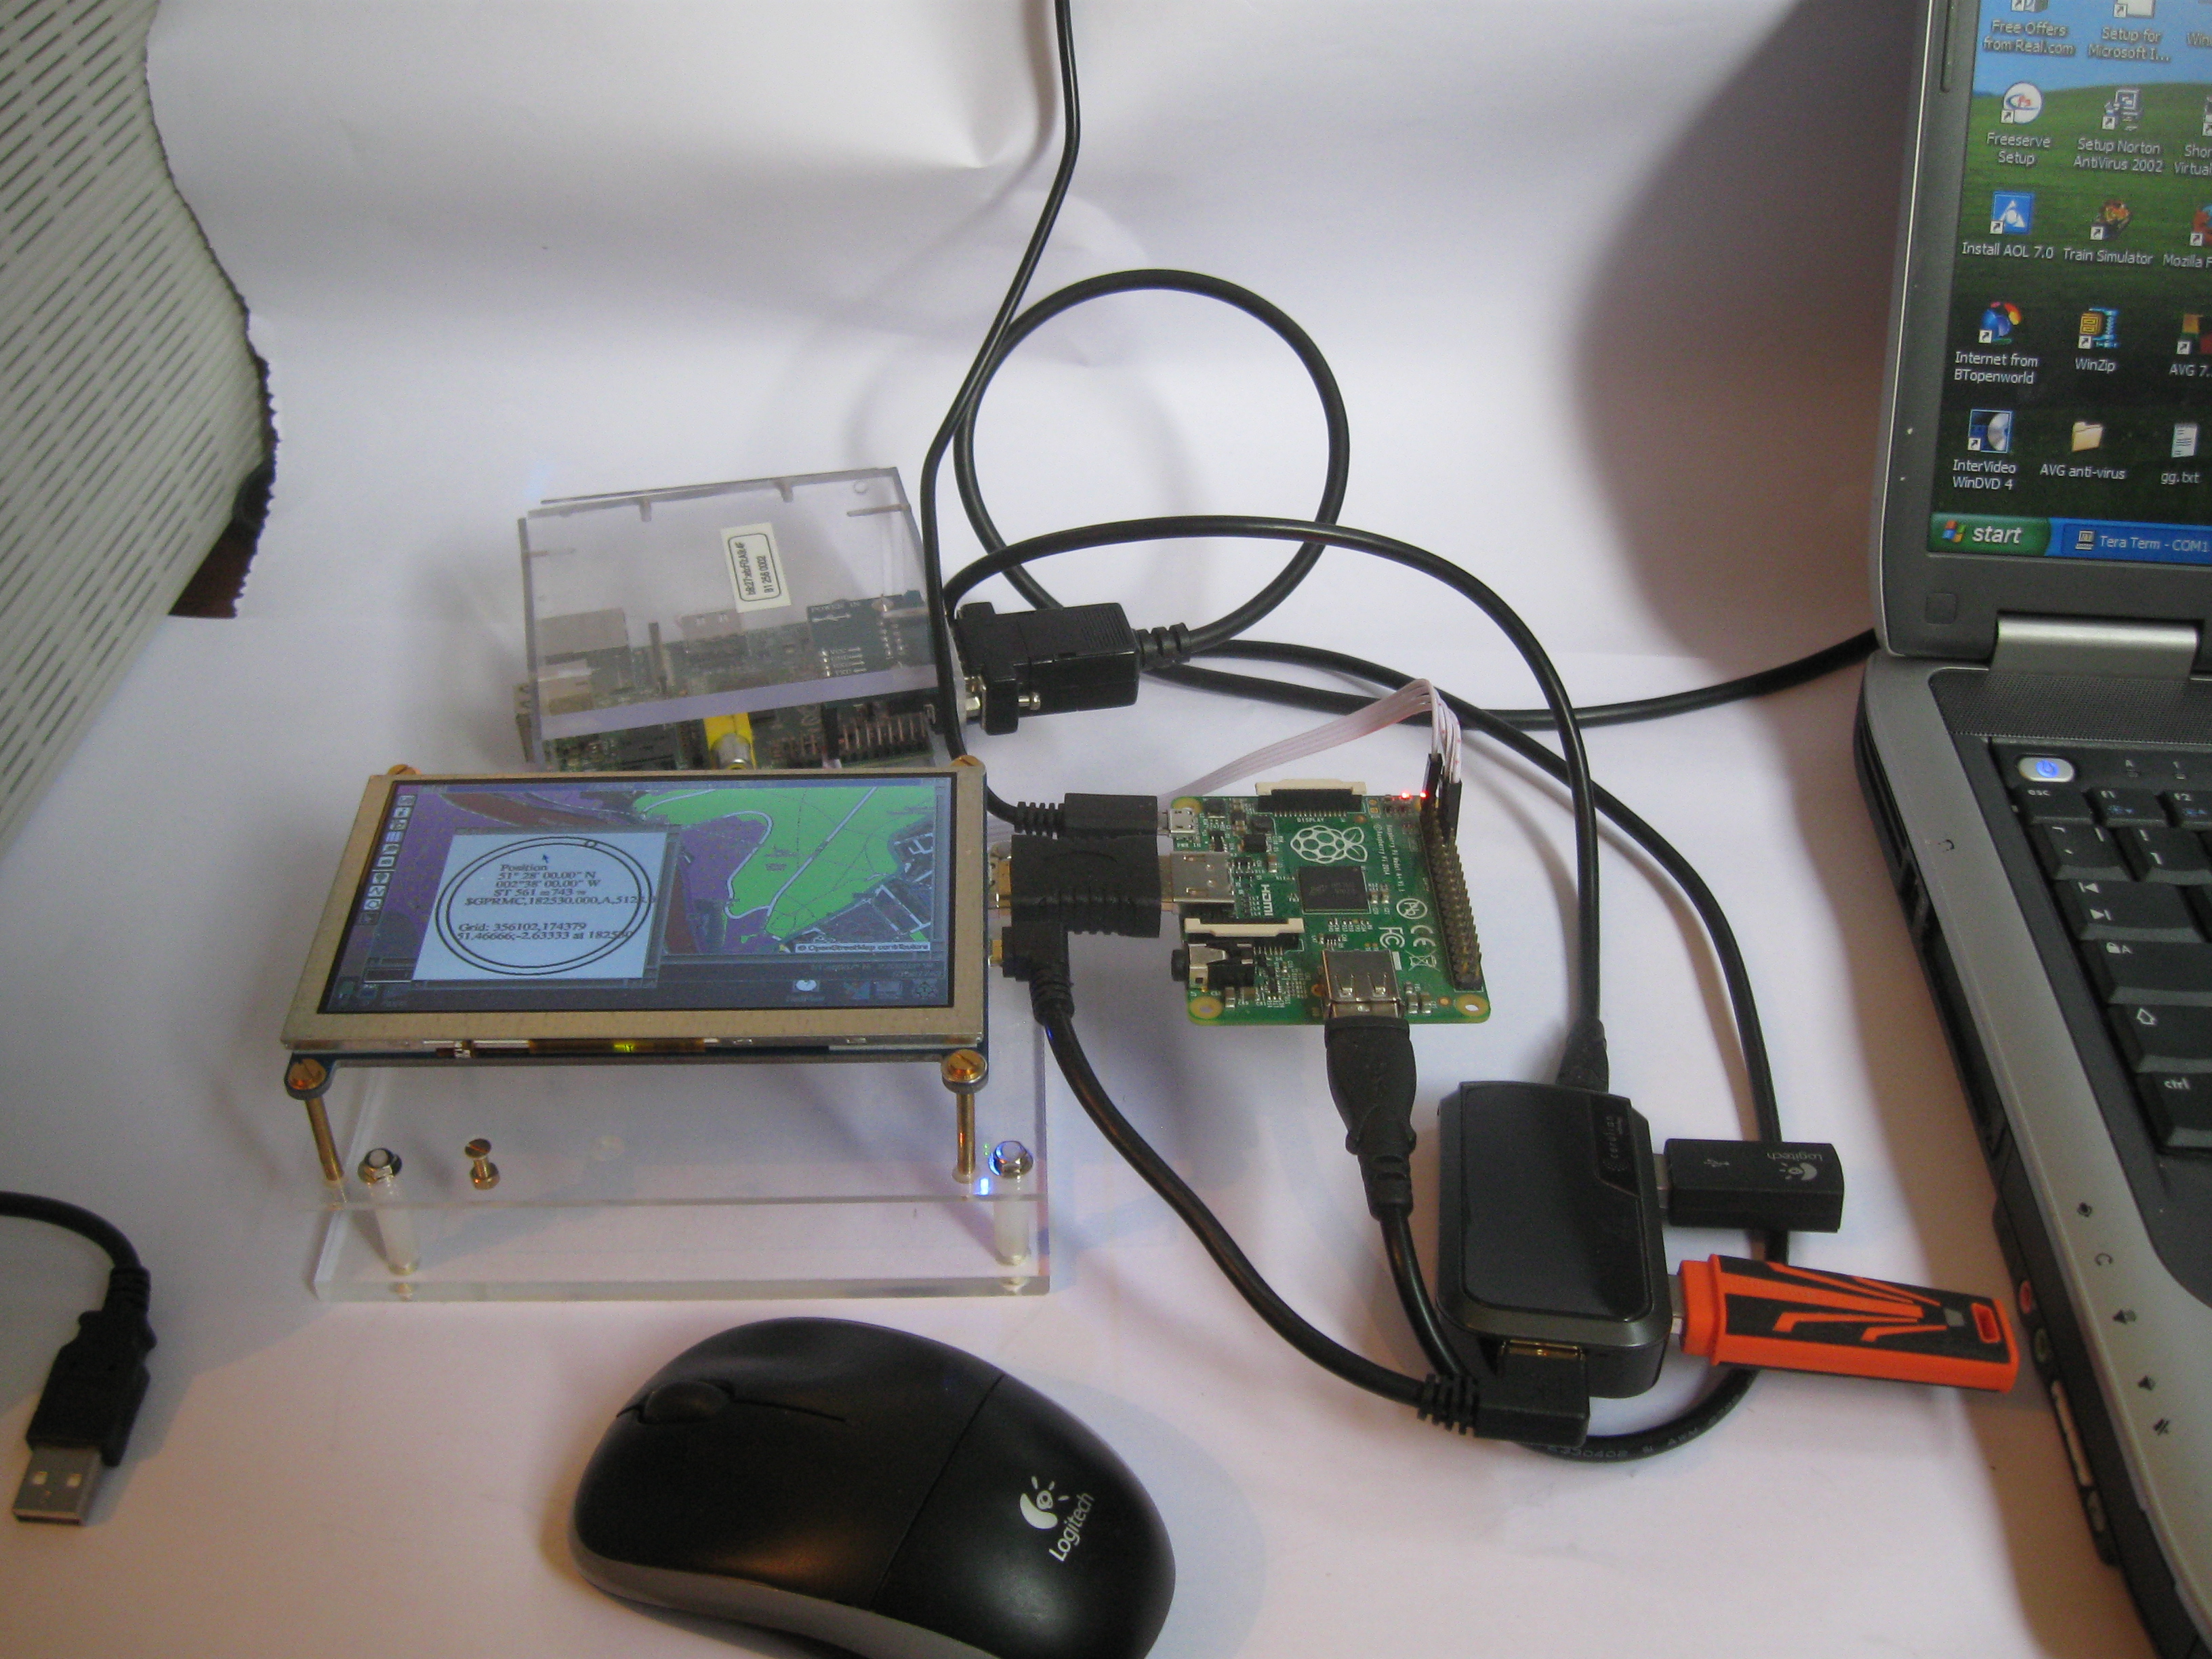
The test set up: a Raspberry Pi early model B which happened to have a serial port (9-way D socket), its leads now connected to the model A+ plugged in to a 800x480 display. Power at 5V temporarily coming from the mains (to the model A+, then via a USB hub to the display, keyboard dongle and pen drive).
The plan was therefore to set up the Pi with a serial cable connected to the PC with a serial console. I would then send some data (purporting to be data from a GPS module) and see whether my software correctly understood it.
I was hoping that the software would be working by the time the GPS module arrived. All I had to do was write a multi-tasking application to receive and understand the GPS data and find some way of telling RiscOSM (so that RISC OS could do something useful with it).
In absence of any better method, RiscOSM accepts a URI, from which it draws a map. The format of this is:
SYS "URI_Dispatch",0,"geo:51.2,-2.9 [;scale=1000 | ?z=16]"
Communicating with RiscOSM (via a ‘geo:’ URI_Dispatch) is not ideal but uses existing functionality in RiscOSM 1.39. An improved method (using messages, with hand-shaking) has since been developed and is supported by RiscOSM version 1.40 onwards.
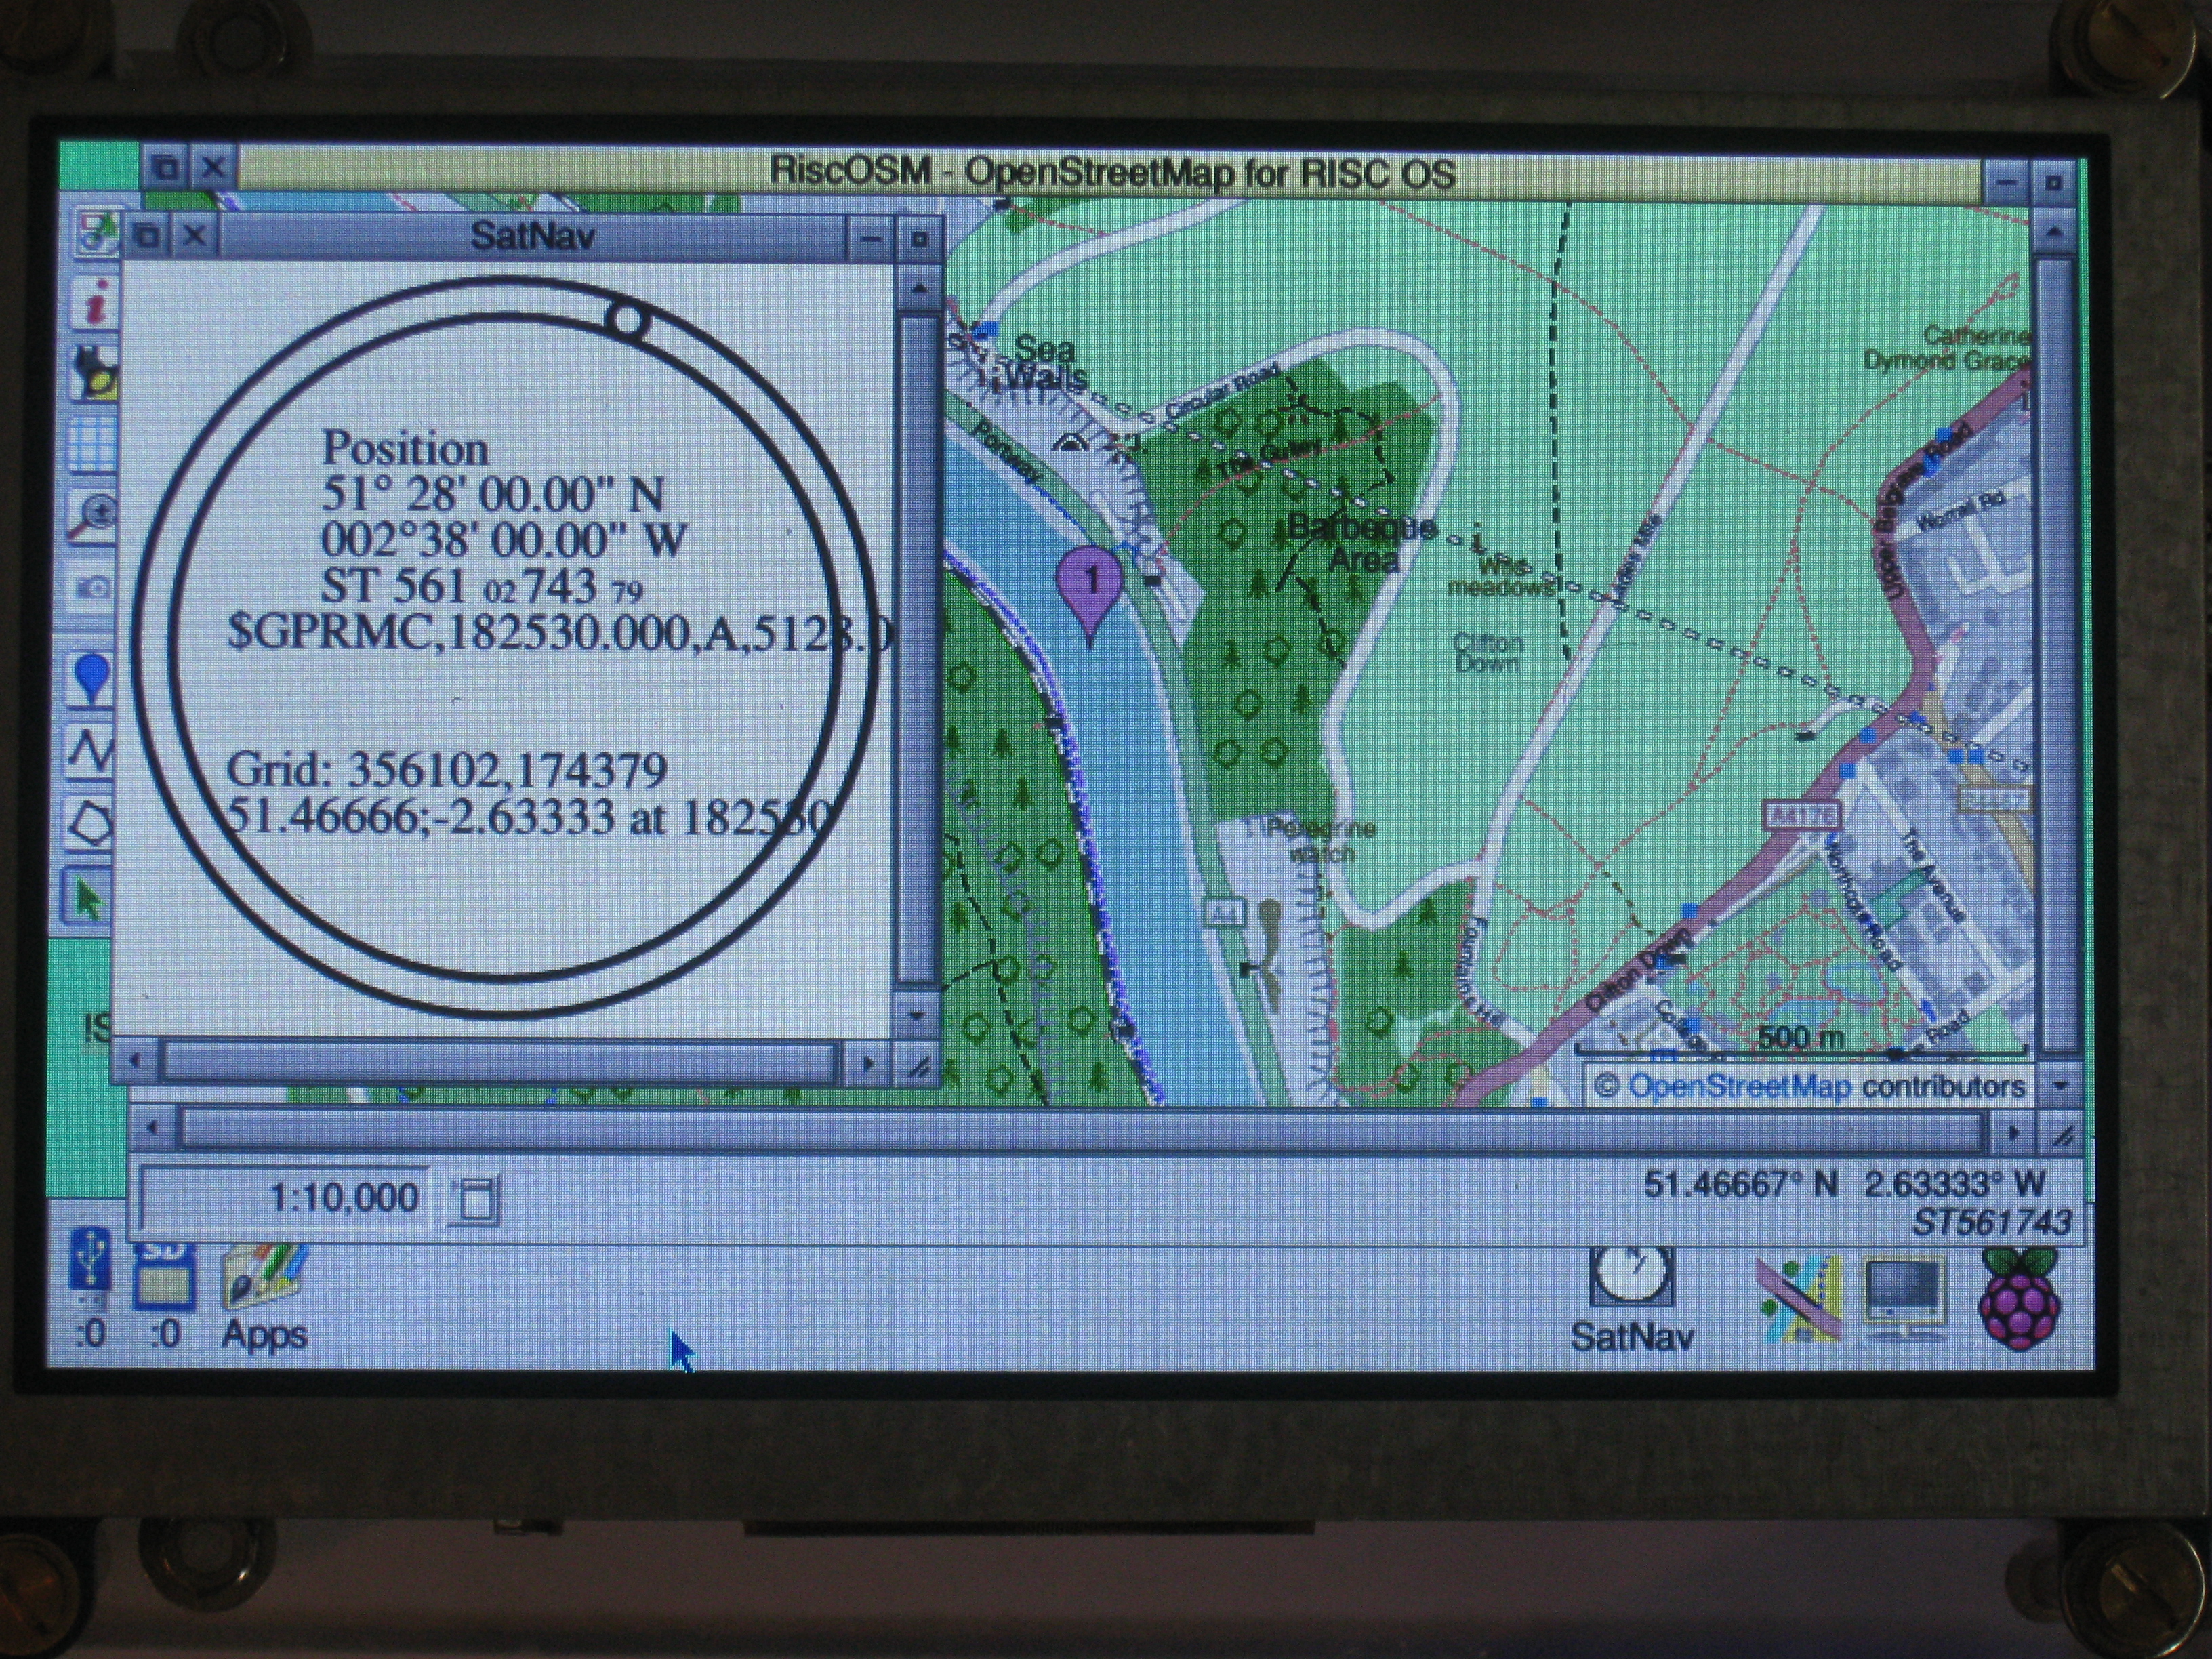
I have typed a string ‘$GPRMC,182530.000,A,5128.000,...’ on the PC and my ‘SatNav’ application has decoded it and broadcast a ‘URI_Dispatch’ message which RiscOSM has picked up and has drawn a map at its default scale. The debug window shows that 51� 28�N 2� 38�W corresponds to ST5610274379.
|
That’s as far as I could get without the GPS module — it was Thursday midday and the DPD delivery (GPS module and a Pi Zero) was due at 3 p.m. — so I waited impatiently for the doorbell. The whole project was fairly cheap, but mainly because it was only the GPS module that I had to buy, the rest I had just pinched from other projects. |
Adding a GPS module
The GPS module needed a header socket to be soldered to it and a battery fitted. I plugged in the module and put it in the window (see photo below). No fix. I went for a walk with it. No fix. I put it at the window again and went to the pub. When I came back a few hours later, it had found a fix and was drawing a map. I noticed that I was sending data so frequently (about once a second) that RiscOSM never finished drawing the map!
Since then I have fitted an external antenna and I now get a fix from cold in about 30s. This is helped by fitting a small battery to the GPS module so that it can retain ‘’‘almanac’ data. With no internet connection, such data would have to be downloaded from each satellite before a fix could be obtained.
The photo shows the assembled unit, with battery (the white lead is just keeping it float-charged), model A+ Pi, GPS Hat and a 800x480 display — not touchscreen as no user input is required. You can see the empty USB socket of the model A+.
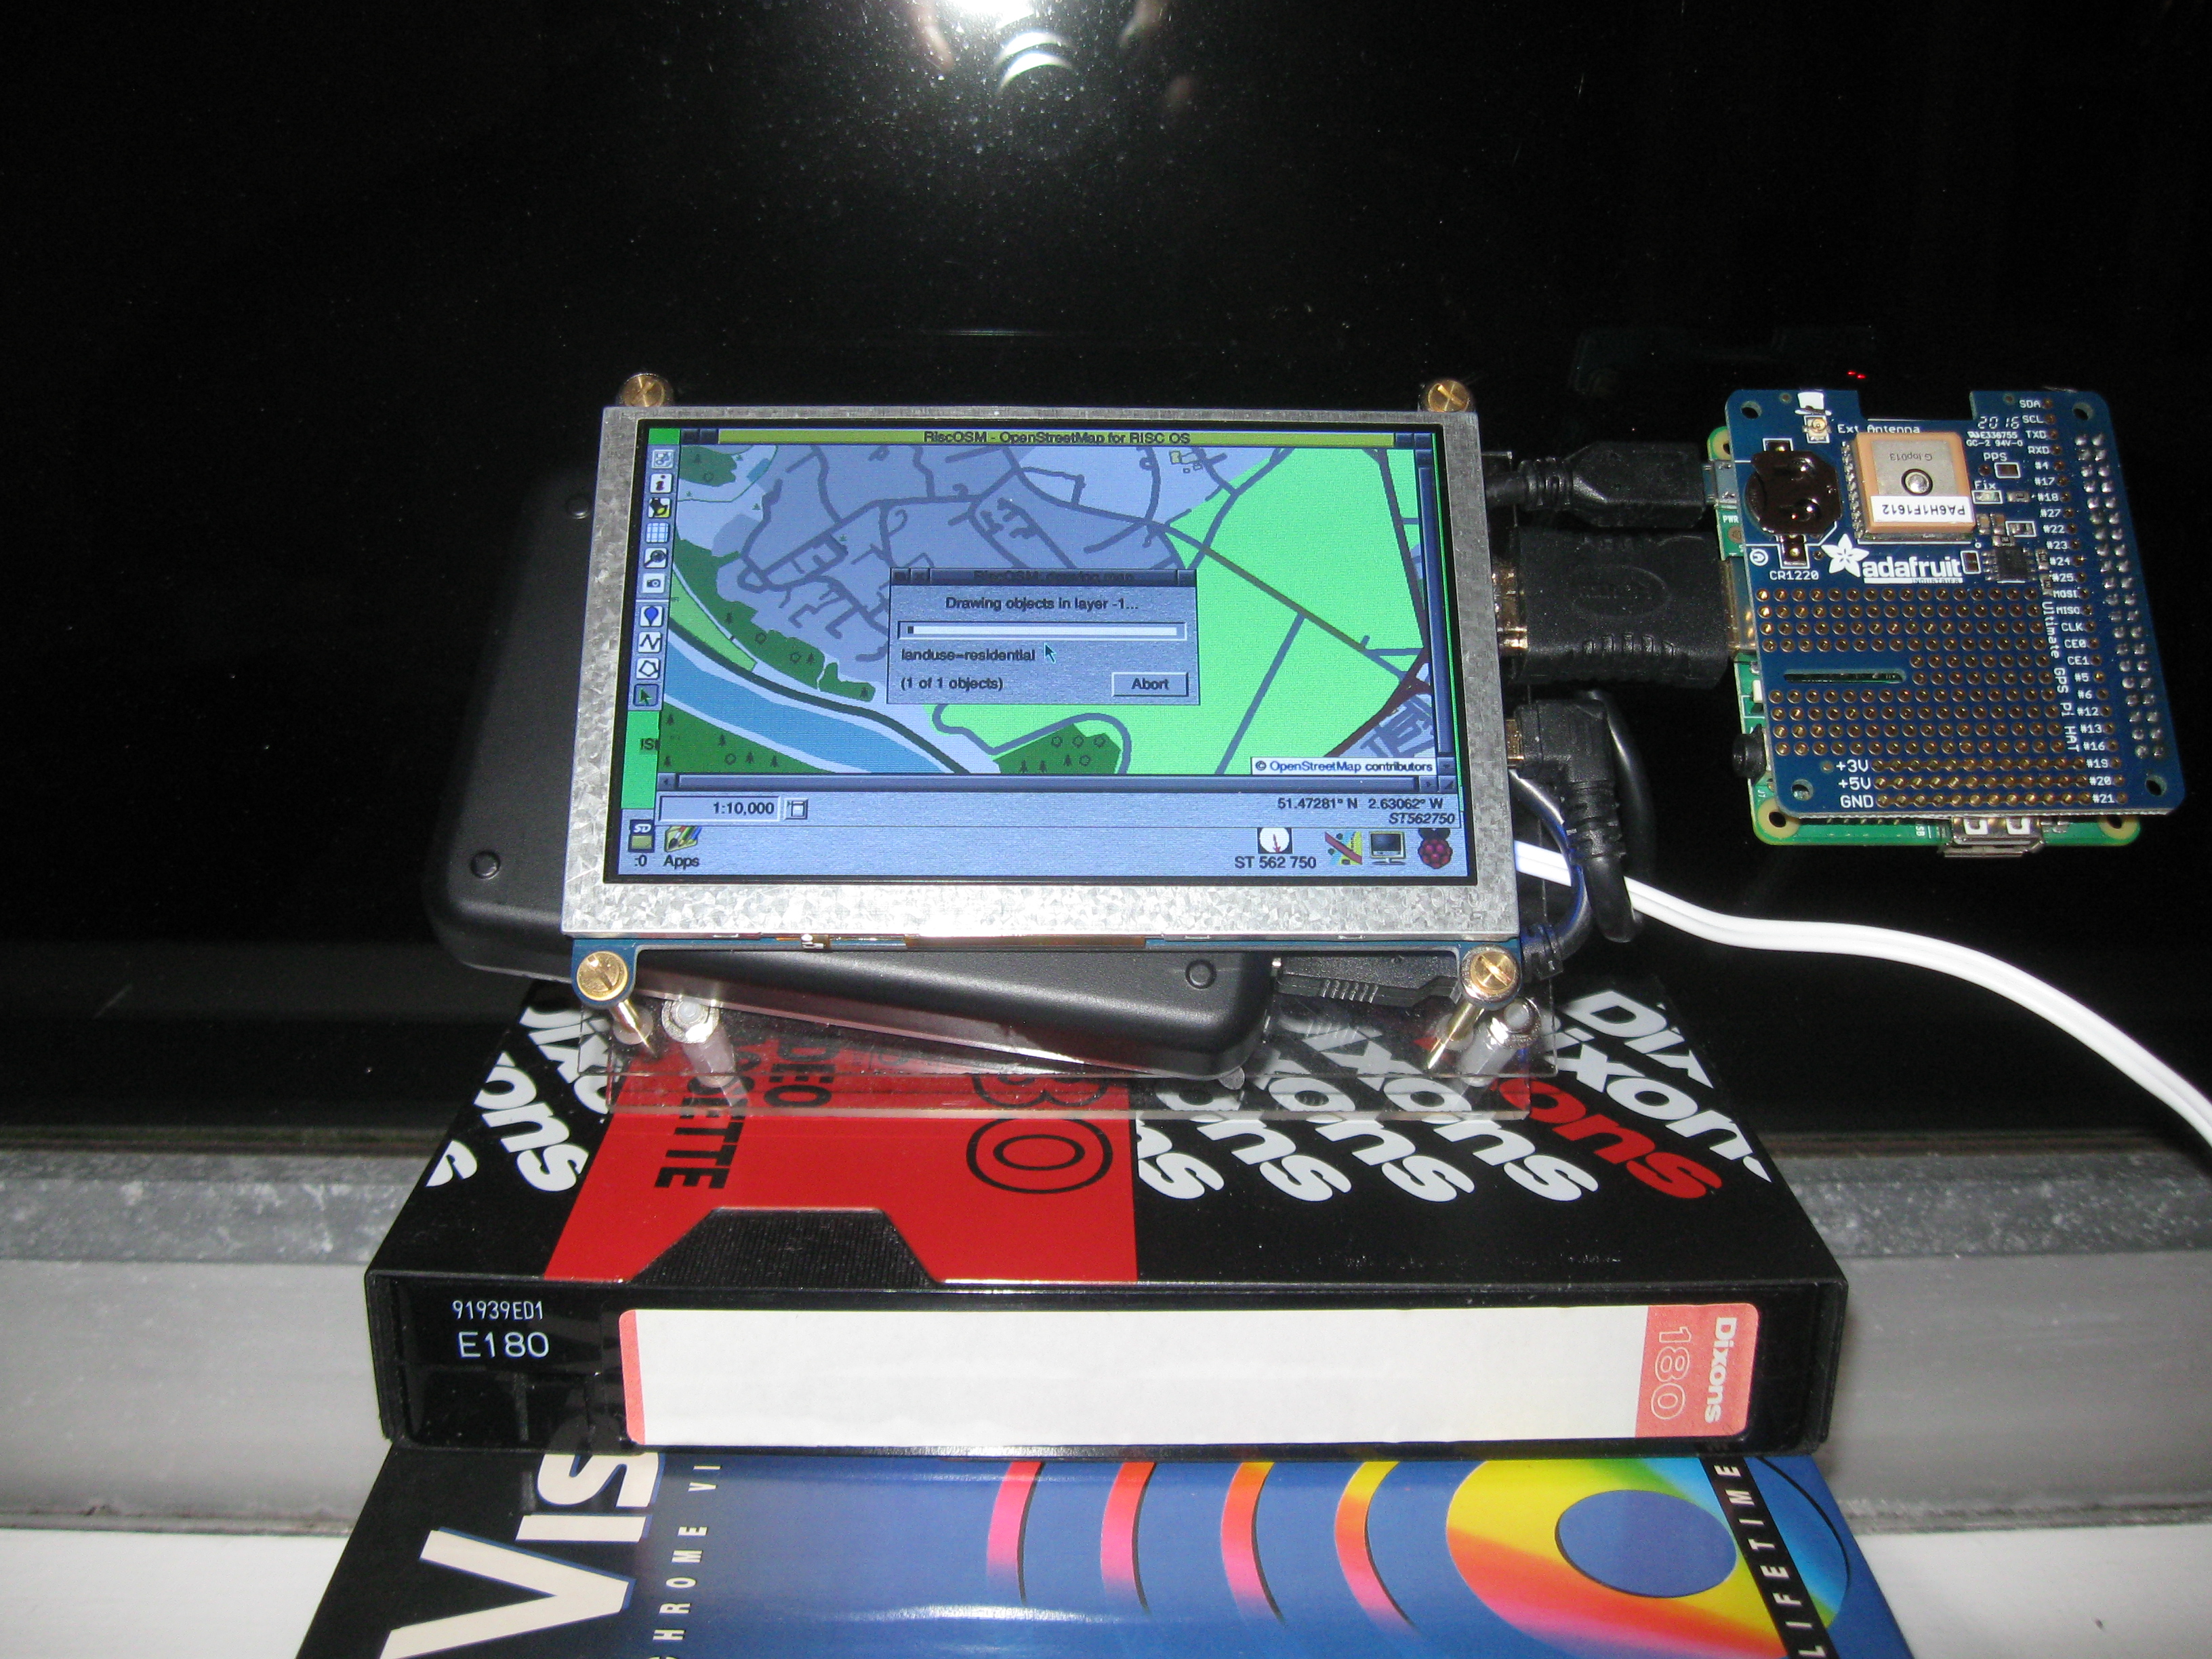
It is working! The LED on the GPS module is flashing every 10s or so (indicating a fix) rather than at 1Hz (no fix). RiscOSM is drawing a map at the location found. My application is showing the grid reference and the direction of travel on its icon bar icon.
I made various improvements: I decided to send location data a little less frequently (to give RiscOSM a little more time to draw the map while the messaging system was being developed) and to improve the decoding algorithm (to use $GPGLL, $GPGSV and $GPGGA messages as well as $GPRMC). I have also tidied up the help messages and now automatically close the status window once a fix is obtained.

A view of version 0.56 showing (in orange) the satellites in view as well as other information..

|
Anquet Export format route files (.AEF) will now have an Acorn filetype (&A6F) and MimeMap entry (registration pending): running (or loading) one will export a series of pseudo GPS signals to simulate the messages that would be produced in real time from GPS. This also allows RiscOSM to show a demonstration indoors (i.e. with no GPS signal available) of it controlling a rolling map during a walk or a train journey as if in real time. For an example (Kings Cross to Welwyn Garden City) is shown (to the left) in an animated GIF. |

Another feature I added was to demonstrate things if no satellite signal was available (indoors at an exhibition for example): if neither the SerialDeviceSupport nor the PiSerial module is present (or is RMKill’d), the application will simulate a GPS signal and take you for a virtual walk in a circle near Midford. You can take this walk if you look at the animated GIF above
I made these changes and the application is now (07-Nov-2016, five weeks after first inspiration) at version 1.01. The status window now shows the sky position of all satellites in view, as well as other data such as altitude (above mean sea level), exact time, date, ground speed, bearing, height (of ground zero), number and sky position (elevation and azimuth) of satellites in view. It is possible to calculate the error in the computer’s clock compared to the accurate atomic clocks on the satellites and the RISC OS ‘clock error’ is now shown with a menu option to set the clock to the correct time in a single click.
 The saved status window (above) contains a lot of data. |
The status window can be saved as a Draw file, including the satellite detail - the Draw file uses a text area object to format the text below the graphic so cannot be loaded into ArtWorks or Impression-X. |
As a desktop application it was now complete
As a desktop application, with full size display (a smaller 6″ 800x480 HDMI displaydid allow portability) SatNav was effectively complete at version 1.01 (07-Nov-2016). A tracking option allows each new location to be recorded (forming a ‘track’) in either Anquet Export Format (‘.aef’) or GPX format. Both formats have an Acorn filetype allocated. An AEF file (type &A6F) can be imported and can then be exported as either AEF or GPX.
Further development
I can carry this device around and have a rolling map following me! It converts latitude and longitude from the WGS84 to the OSGB36 coordinate system and thence to OS grid reference. When I first started developing SatNav, the only option for serial port data communication on the Raspberry Pi under RISC OS was the 'PiSerial block drivers, which did not run on the model 2, 3 and Zero. By 26 October 2016 RISC OS ROMs for the Pi included Serial support.
So, I thought, had I finished this project? Apparently not: a friend on the Severn Valley Railway, a Driver, Signalman and Signal Engineering Technician, said it would be a good idea to have a speedometer on the footplate of an engine (steam engines on a preserved railway do not normally have these fitted).
I thought this would be a nice challenge - an even smaller box, a small text display rather than an HDMI monitor and a smaller GPS module. There would be an entirely simplified user interface - no user input and a simple text display as the only output. But I had never thought about interfacing a small text display (many of which are very cheap and are sent directly from China) to the Raspberry Pi. Fortunately the RISC OS Group of London (ROUGOL) were holding a computer show at the end of October 2016 and so I could pick some brains.
One stand actually had a small text display (of the type I had in mind) showing various parameters such as temperature. What is more, I was given the software drivers that I needed.
The 16 character x 2 line display has four pins for input: on the Pi these corresponded to header pin nos. 2 (5V), 3 (I2C DAT), 5 (I2C CLK) and 9 (GND). The GPS module has 9 pins but only four of these were actually needed: header pin nos. 4 (5V), 6 (GND), 8 (TXD) and 10 (RXD). It is possible to transmit messages to the GPS module to tell it to send data more frequently or more selectively but I have not yet tried this. I had also found a nice, small battery (Maplin A71UU) which would provide 5V. I was confident I could fit all that into a small box.
The first test was to make sure that I could, indeed, drive the text display so I did a bit of research. The drivers I had been given were for a slightly different display - initialising the display I was using proved to be slightly different. The following BASIC code provides the necessary procedures to send a command to the display:
|
This simply splits the command byte into two 4-bit nibbles and sends them using the SYS "OS_IICOp" SWI. The command &33 is required to be sent as the first command by the particular display I am using so I will use it to see whether the device exists - if not, I would get an error either 'SWI name not known' or 'IIC device failed to acknowledge' and this would set the flag lcd% to FALSE so that no further attempt would be made to communicate if the device was not there! To set up the LCD display requires just a few simple commands: |
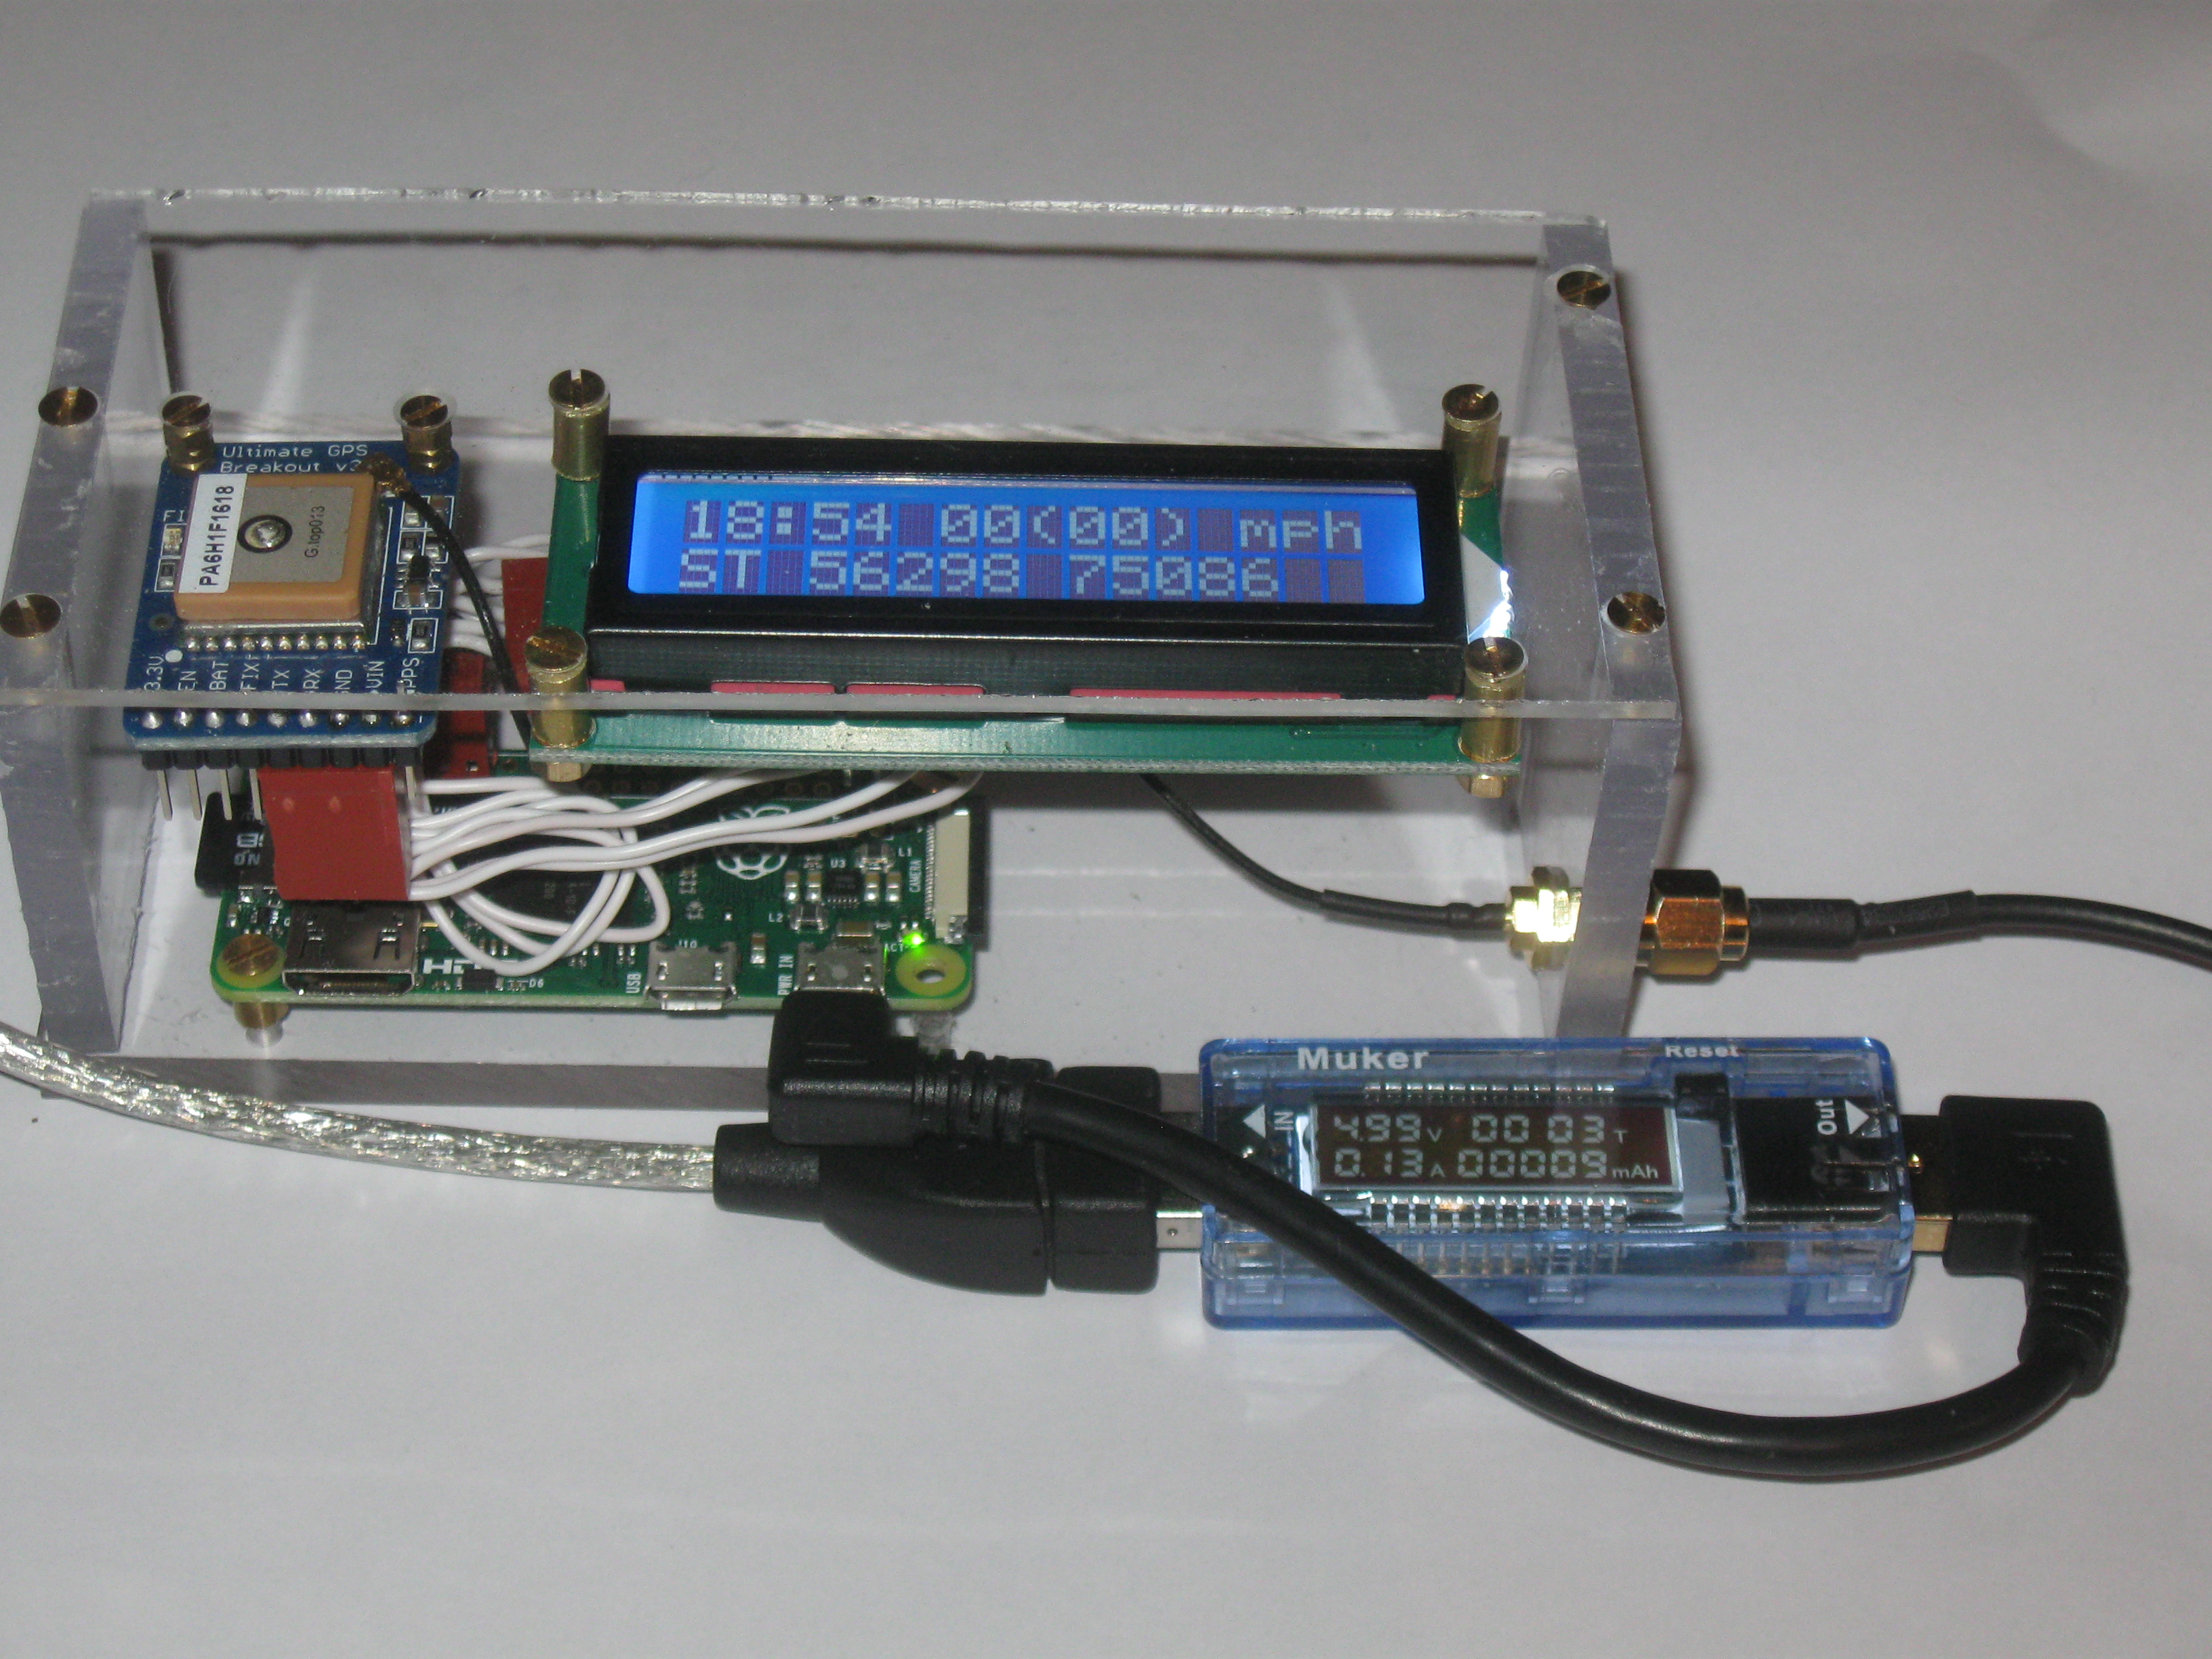
Now housed in a neat case with battery, display, Pi and GPS module. An external antenna significantly improves the time for the first fix. The case measures 134mm wide, 50mm high and 66mm deep.
| The process for sending character data to the display is very similar to the process for sending a command - just one further bit is set apart from EN% (4 - enable) which is RS% (1 - register select). So to send some characters requires the code shown to the left. The command &80 is the command (LCD_SETDDRAMADDR) to set the destination memory address for the character or string being sent - the position is set by adding: &00 - line 1 &40 - line 2 n - character column n after which the character(s) may be sent using PROClcd_string. |
So it proved a simple matter to add a small 2 lines by 16 character text display, see picture above. Clearly it cannot display all of the information in the status window so I made a selection of the most useful stuff. From version 0.90 of !SatNav onwards a 16x2 text display is supported if one is fitted to a Raspberry Pi.
This was a useful prototype but the speed display was so small as to be hardly recognisable on a locomotive footplate. Something even smaller and simpler was the next plan.
Smaller but bigger!
As the information provided from GPS includes exact time and date: the OS could therefore be a client — with no internet connection and no real time clock, GPS will provide an accurate UTC value. These data would, ideally, be shared by using a defined set of messages. So some standard Wimp message formats and handles will need to be defined.
I saw on the ROOL forum (look up ‘SPI display’) that an I2C-connected OLED display provided a better option - a 128 bit by 64 bit display - so I could do a ‘large print’ version - displaying speed in mph from 0 to 150. This display is more economical in current consumption as it has no backlight and contrast is better. The OLED display can also show 8 lines of 16 characters each. The drivers were also available from Rick Murray’s web site (http://heyrick.co.uk/software/oled) with a full tutorial to show how to speed up the I2C bus (a ROM hack) and to modify the display to work correctly (not necessary for the display I got). The module OLED 0.03 has a StrongHelp manual and worked first time. It provides a simple set of commands would either send a sprite or write a text string.
Now all I needed to do was to decide what I wanted to display! I thought that milepost mileage would be nice to add: this is defined for the Severn Valley Railway measured along the trackbed: where the trackbed is wide (e.g. at stations) then the milepost mileage will be the same at locations perpendicular to the direction of the line. So I need to find the nearest point to the GPS fix that is on the line of the railway and by looking at the next point along the line in each direction, find the location along the line from which a perpendicular intersects the GPS location.
Grid reference, speed and time would be easy enough to add - these are easily calculated from latitude and longitude despite having to change co-ordinate systems. To define milepost mileage I traced the line of the SVR using RiscOSM (it allows you to select the mode of transport (walk, car, bike, railway train) and then allows you to trace along a relevant permitted byway) and stored the waypoints in an array, noting the milepost mileage and any discontinuities (there are two) so that I could infer milepost mileage by interpolation between waypoints.
Now I could find the nearest waypoint to the GPS location and then drop a perpendicular to the line to the next nearest waypoint in either direction and work out the intercept ratio of each to identify the 'true' position along the SVR. The milepost mileage changes at Bewdley South and at Kidderminster so this needs to be taken into account as well.
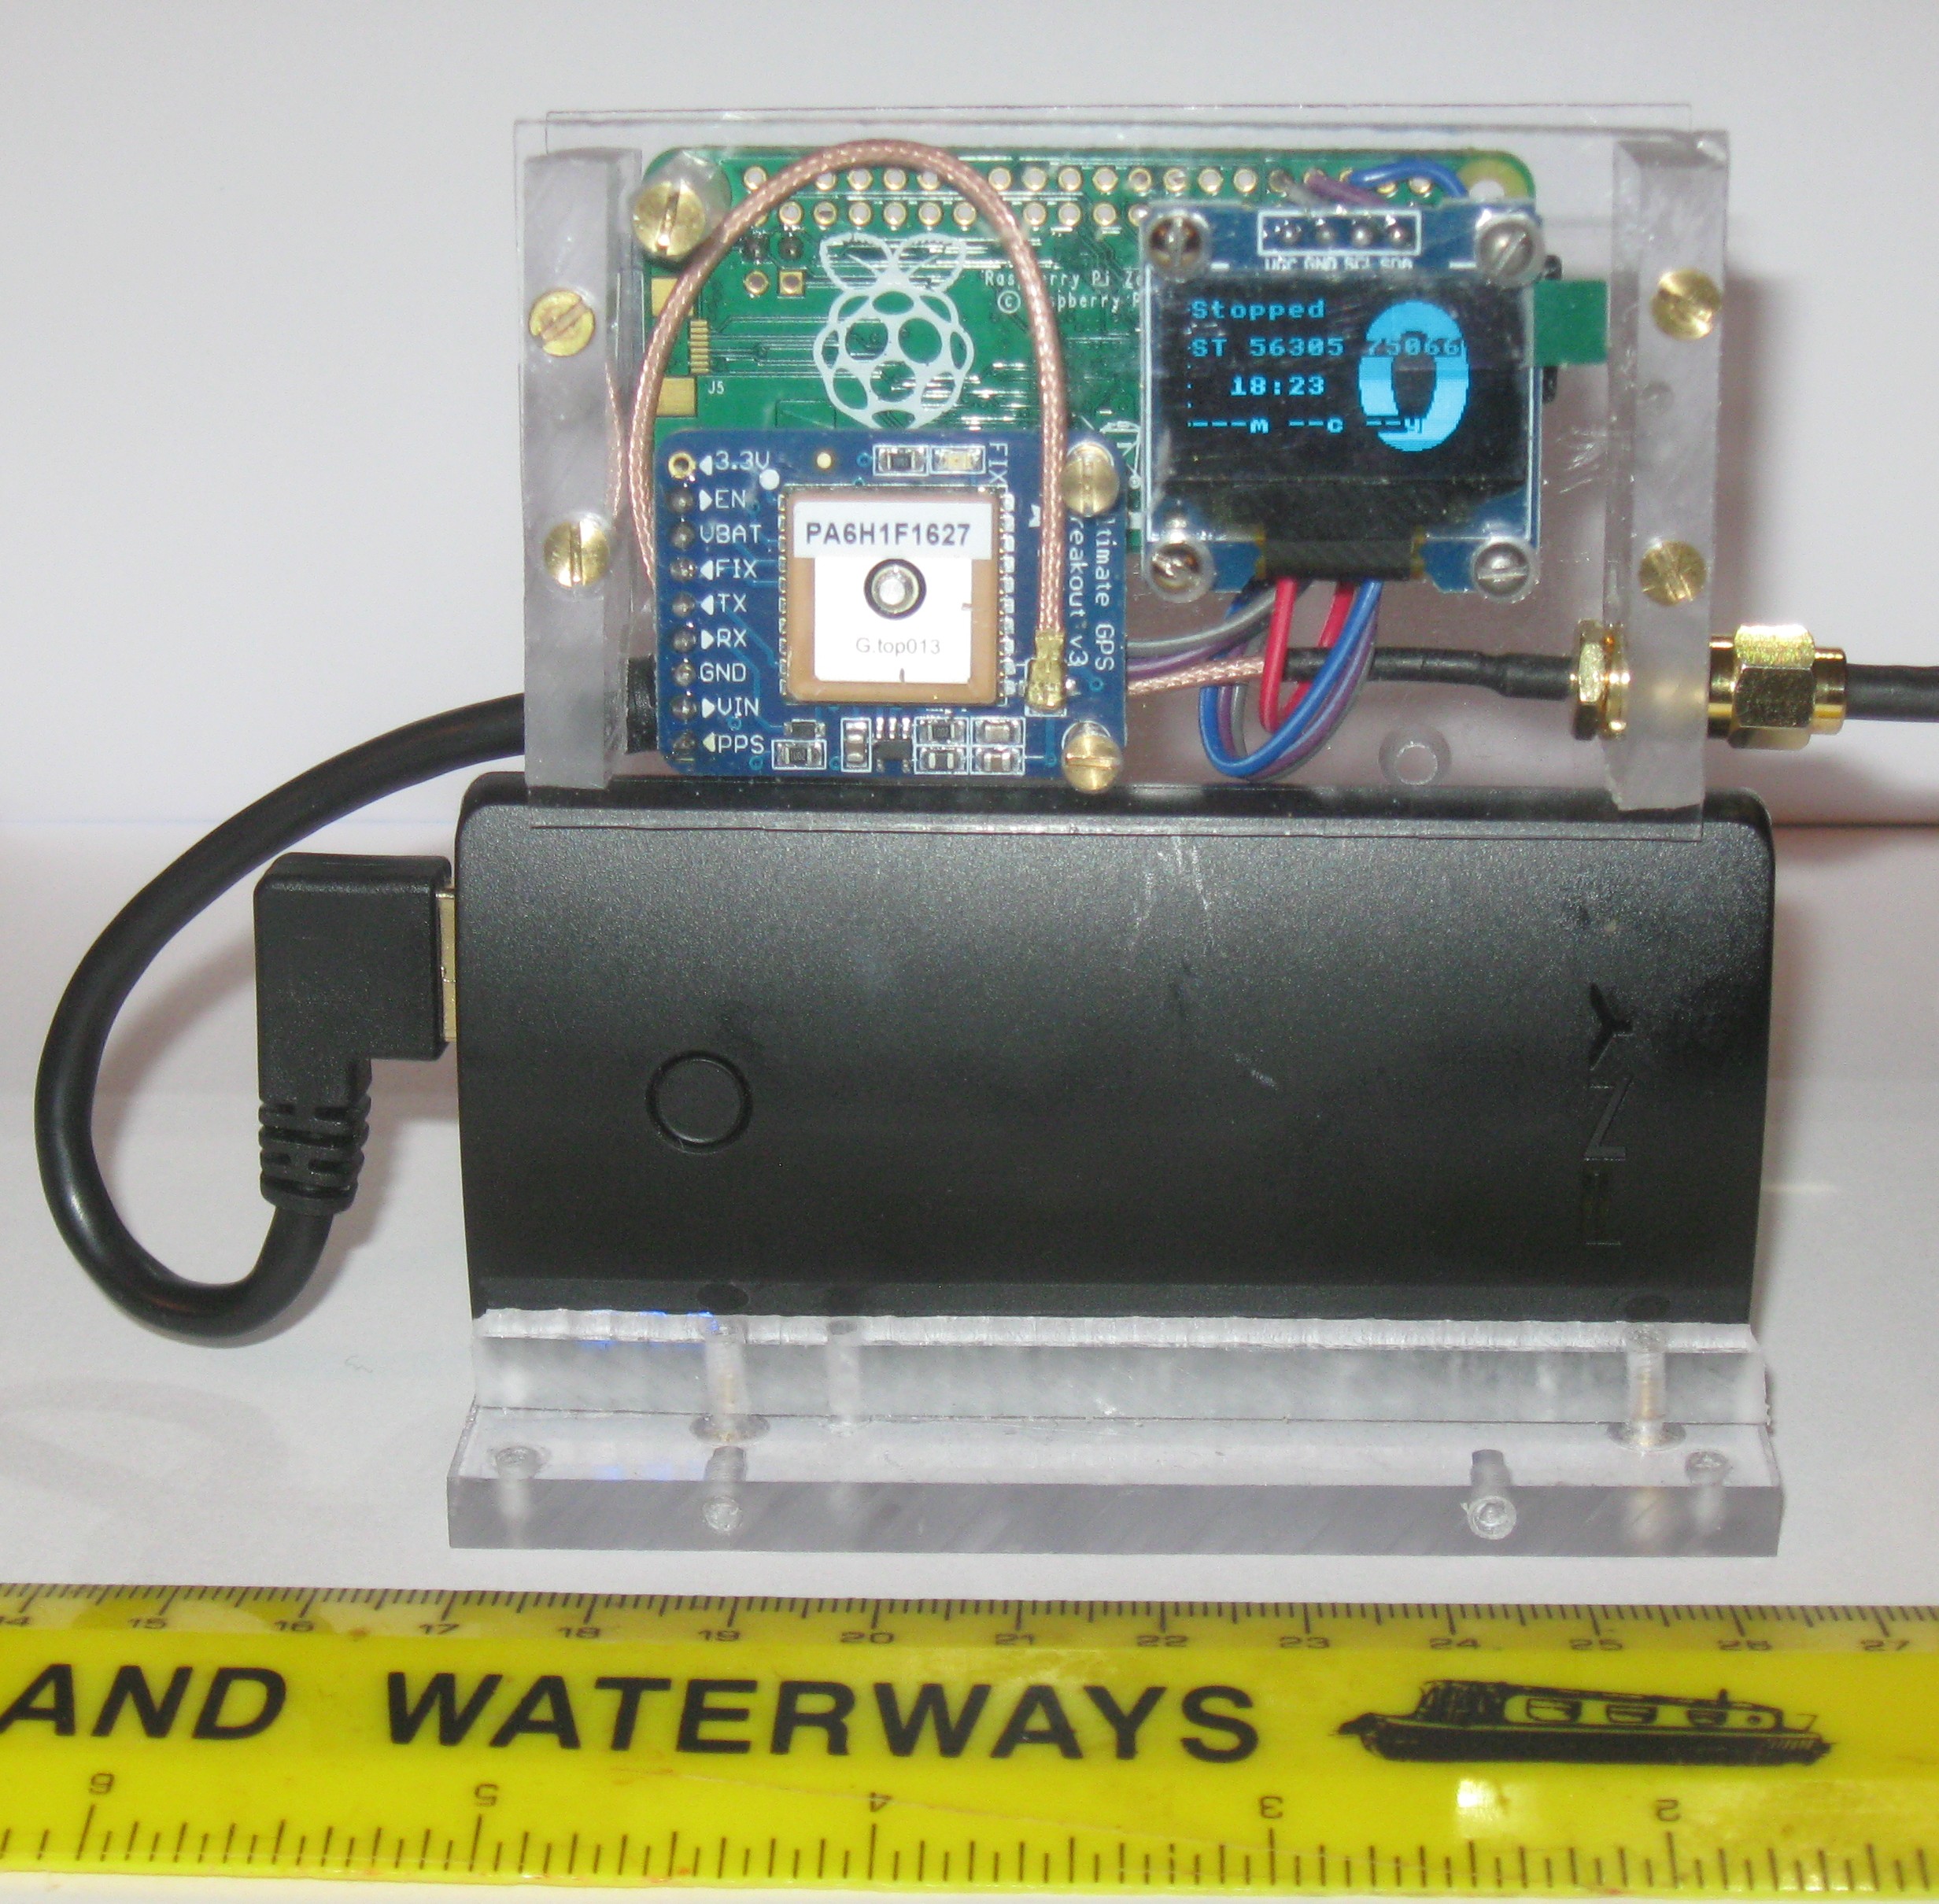
A smaller case with battery, display, Pi and GPS module. This shows grid reference, milepost mileage (blank as Bristol is too far away from SVR). The case is 85mm wide, 25mm thick and 50mm high.
Behind the scenes there is a lot going on but with no desktop display none of this is presentd to the user:
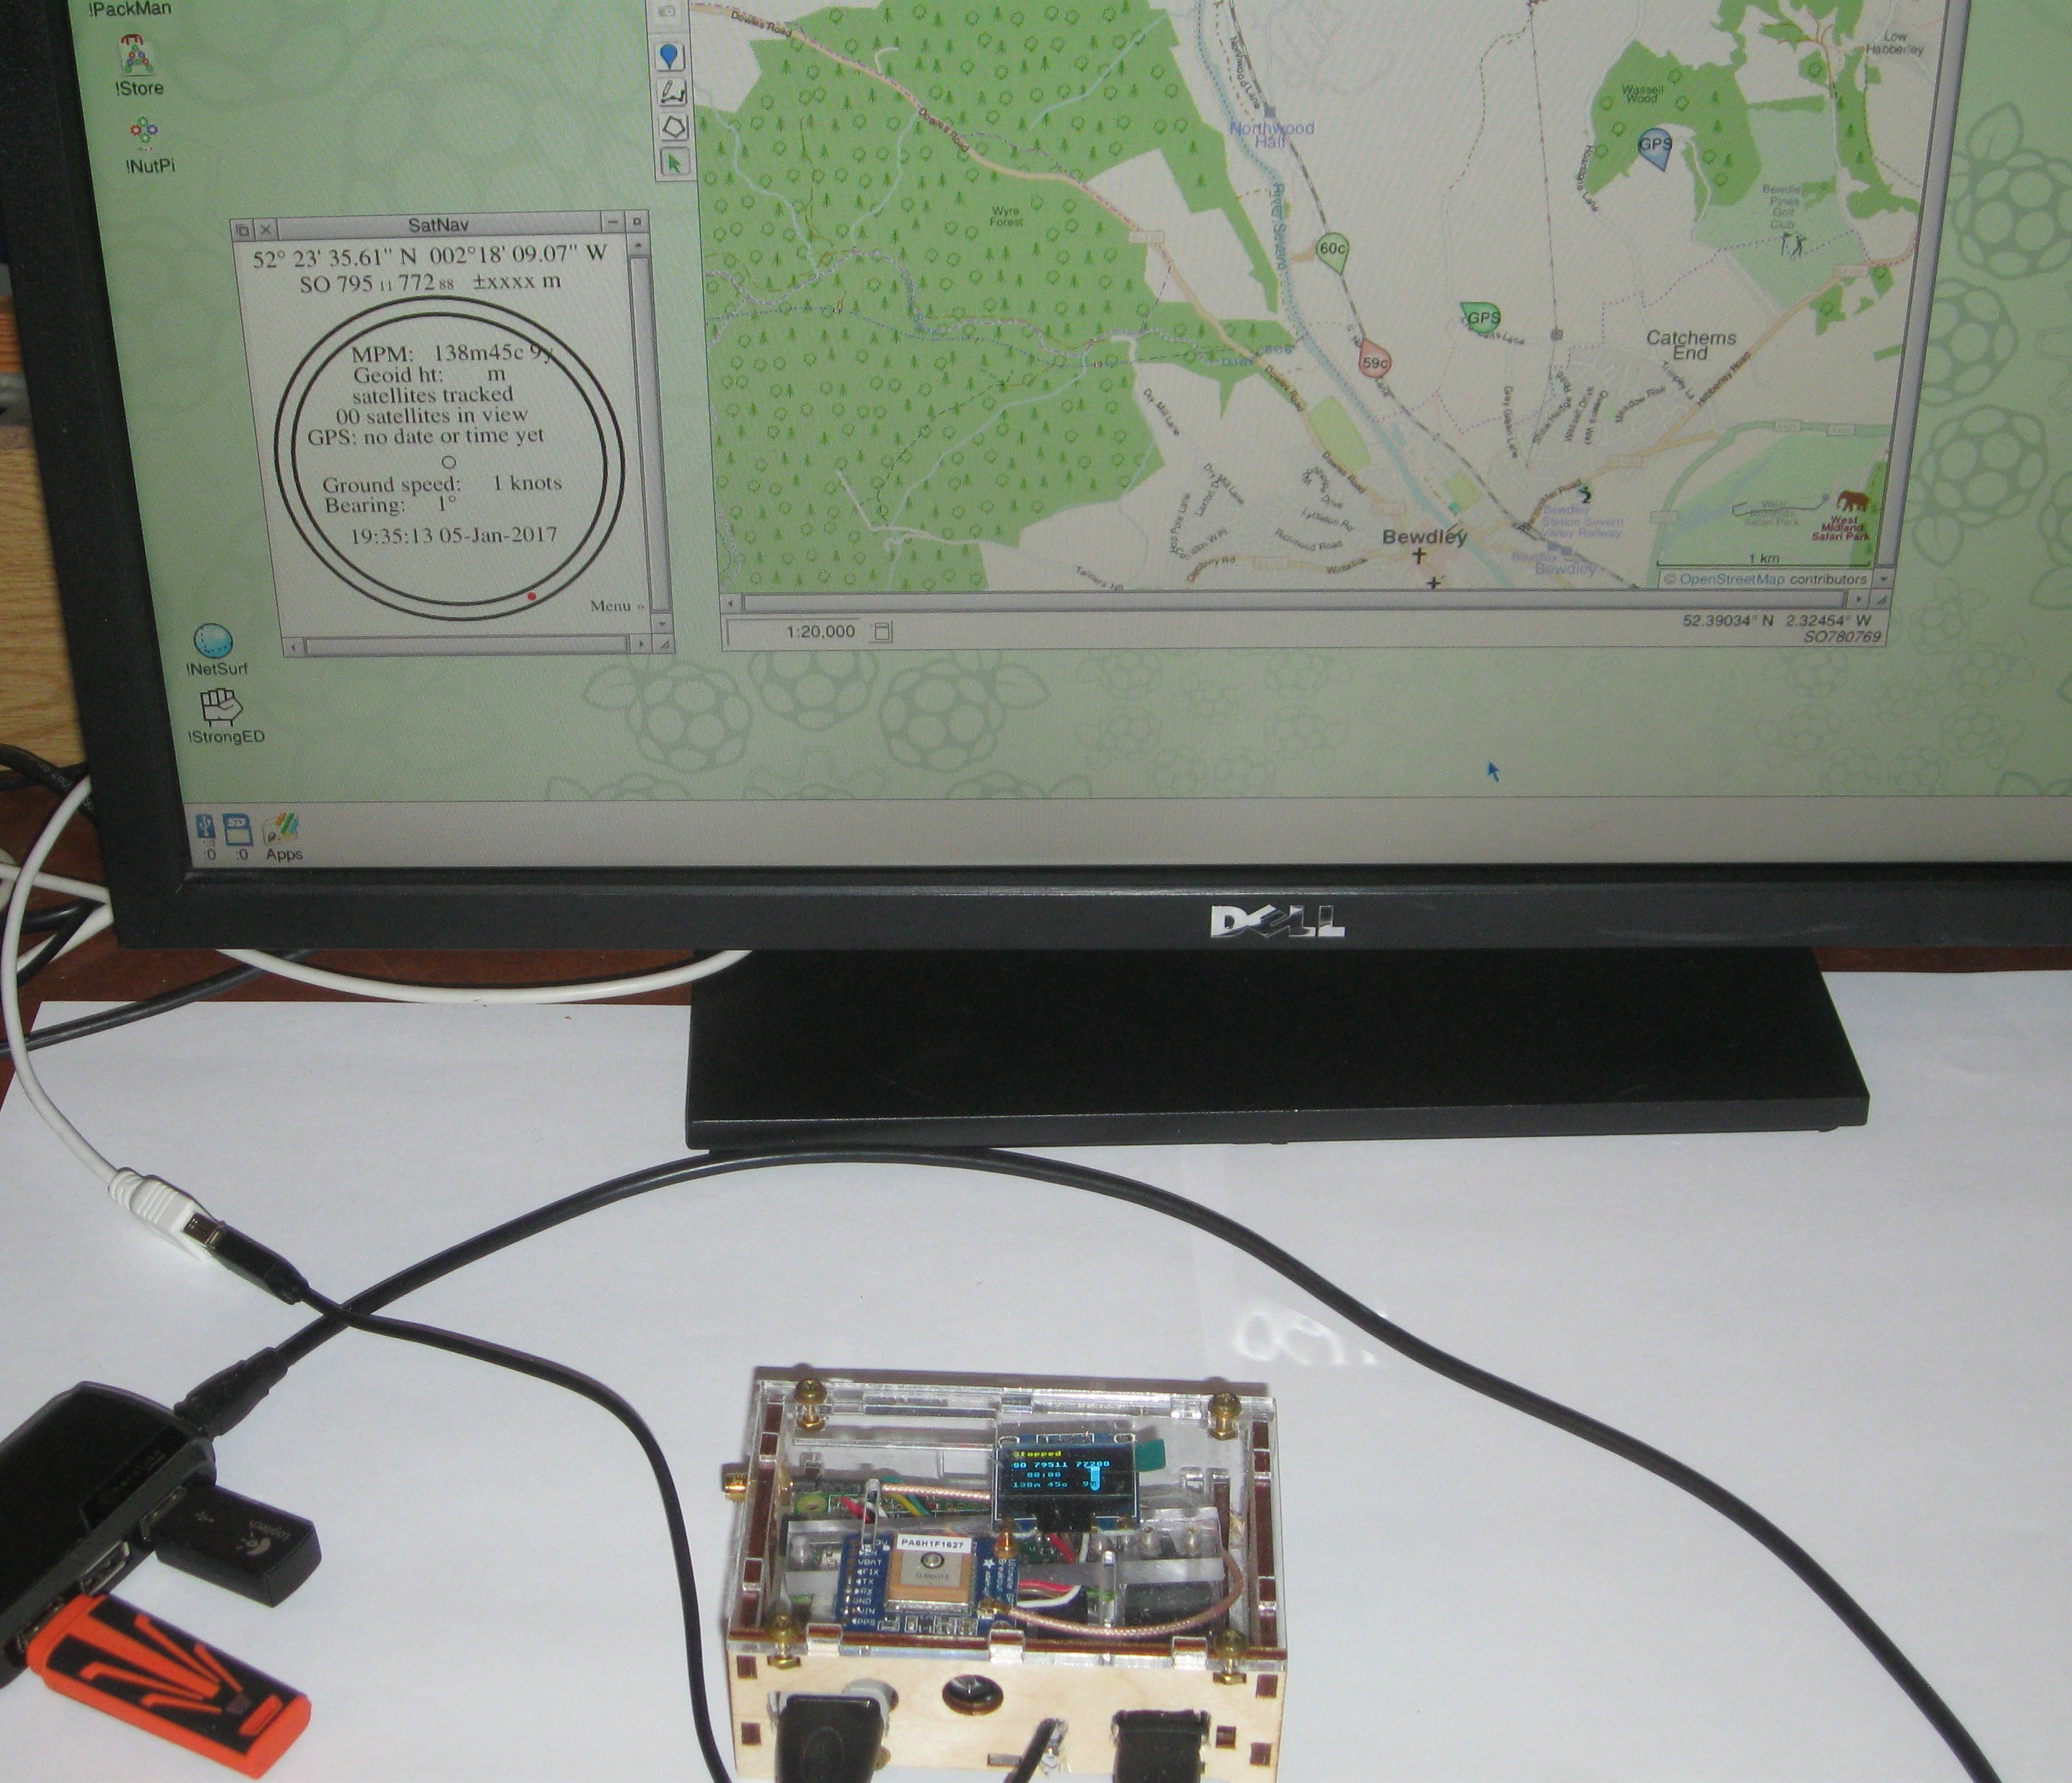
This shows a GPS fix (green circle, marked ‘GPS’) and the corresponding point on the SVR (pink circle, marked &squo;60c’) with a display showing 1m.p.h. along with grid reference and milepost mileage. At higher speeds just the speed is shown.
I modified !SatNav to talk to a text display (if present, either an 128x64 OLED or a 16x2 text display) and to display (via RiscOSM) not just the GPS location on the map, but also the location of the point along the SVR where a line at right angles to a line from the nearest point and the adjacent points on the SVR intersects the GPS location.
I then set the ‘no fix’ demonstration to walk in an ellipse around Bewdley so that I got near enough and far away enough from the SVR to trigger an estimate of the milepost mileage some of the time. The picture above shows the module and a RiscOSM map.
This fitted into an even smaller box (85mm wide, 24mm high and 50mm deep, 100mm deep including battery) providing just a mph display when on the move and more details (such as milepost mileage, 1m grid reference and time) when at a stand.
I ordered a blue and a blue/yellow OLED LED display from digitalcure via ebay (cost £6.50 including P&P) and the Raspberry Pi Zero from PiHut (£6.50 including P&P), the only ‘expensive’ bits were the Adafruit Ultimate GPS module from Makersify (£39 including P&P), a GPS antenna on a long cable (£16) and a 5V 5200mAh battery from Maplin (£16.99). Adding a PCB plug (�FL) to SMA socket cable (£5.70 from Farnell) and a USB male to male cable (£4) the total cost of the project was just under £100.
Version 1.02 of SatNav ironed out the final bugs (serial data are transmitted without handshaking and so can arrive slightly garbled: the checksum is there so that garbled NMEA sentences can be discarded but I had made an assumption that the checksum at the end of the sentence, before the end-of-line character, would be exactly two characters long. Sometimes it wasn’t. With just an OLED display and no monitor and error box on the screen has the effect of freezing things).
Version 1.08 of SatNav supports the OLED display and no longer provides the PiSerial drivers (the Serial module is now in ROM). The next task seems to be to add an odometer.
Further development again
I wanted to tell my Raspberry Pi to shut down and turn back on after a prescribed delay. The purpose of this was to allow the Pi to remain in a ‘very low power’ state, waking up briefly to check the GPS module to see whether it had moved, and only staying awake to monitor the distance it covered.
I asked for ideas on the ROOL forum and the ‘Witty Pi’ was suggested. This board offers a RTC chip and power control module, set up so that Alarm 2 (or setting GPIO pin 4 low) turns off the module and Alarm 1 turns on the module.
The RTC chip it uses (CS3231SN) is sufficiently similar to the DS1337 already supported by RISC OS that is ‘just works’. It is not very cheap (it costs about £20) but it seemed to present a simple solution to my problem.
Ignoring the manual (which explains what software Linux needs) I just connected the boards together and powered the Pi board normally. I then set the RTC from the RISC OS !Alarm application, switched off and then powered the Pi via the Witty Pi board.
Press the button on the Witty Pi and RISC OS starts up. Press it again and it turns off. No clever stuff so far - this is just what the Witty Pi was designed to do.
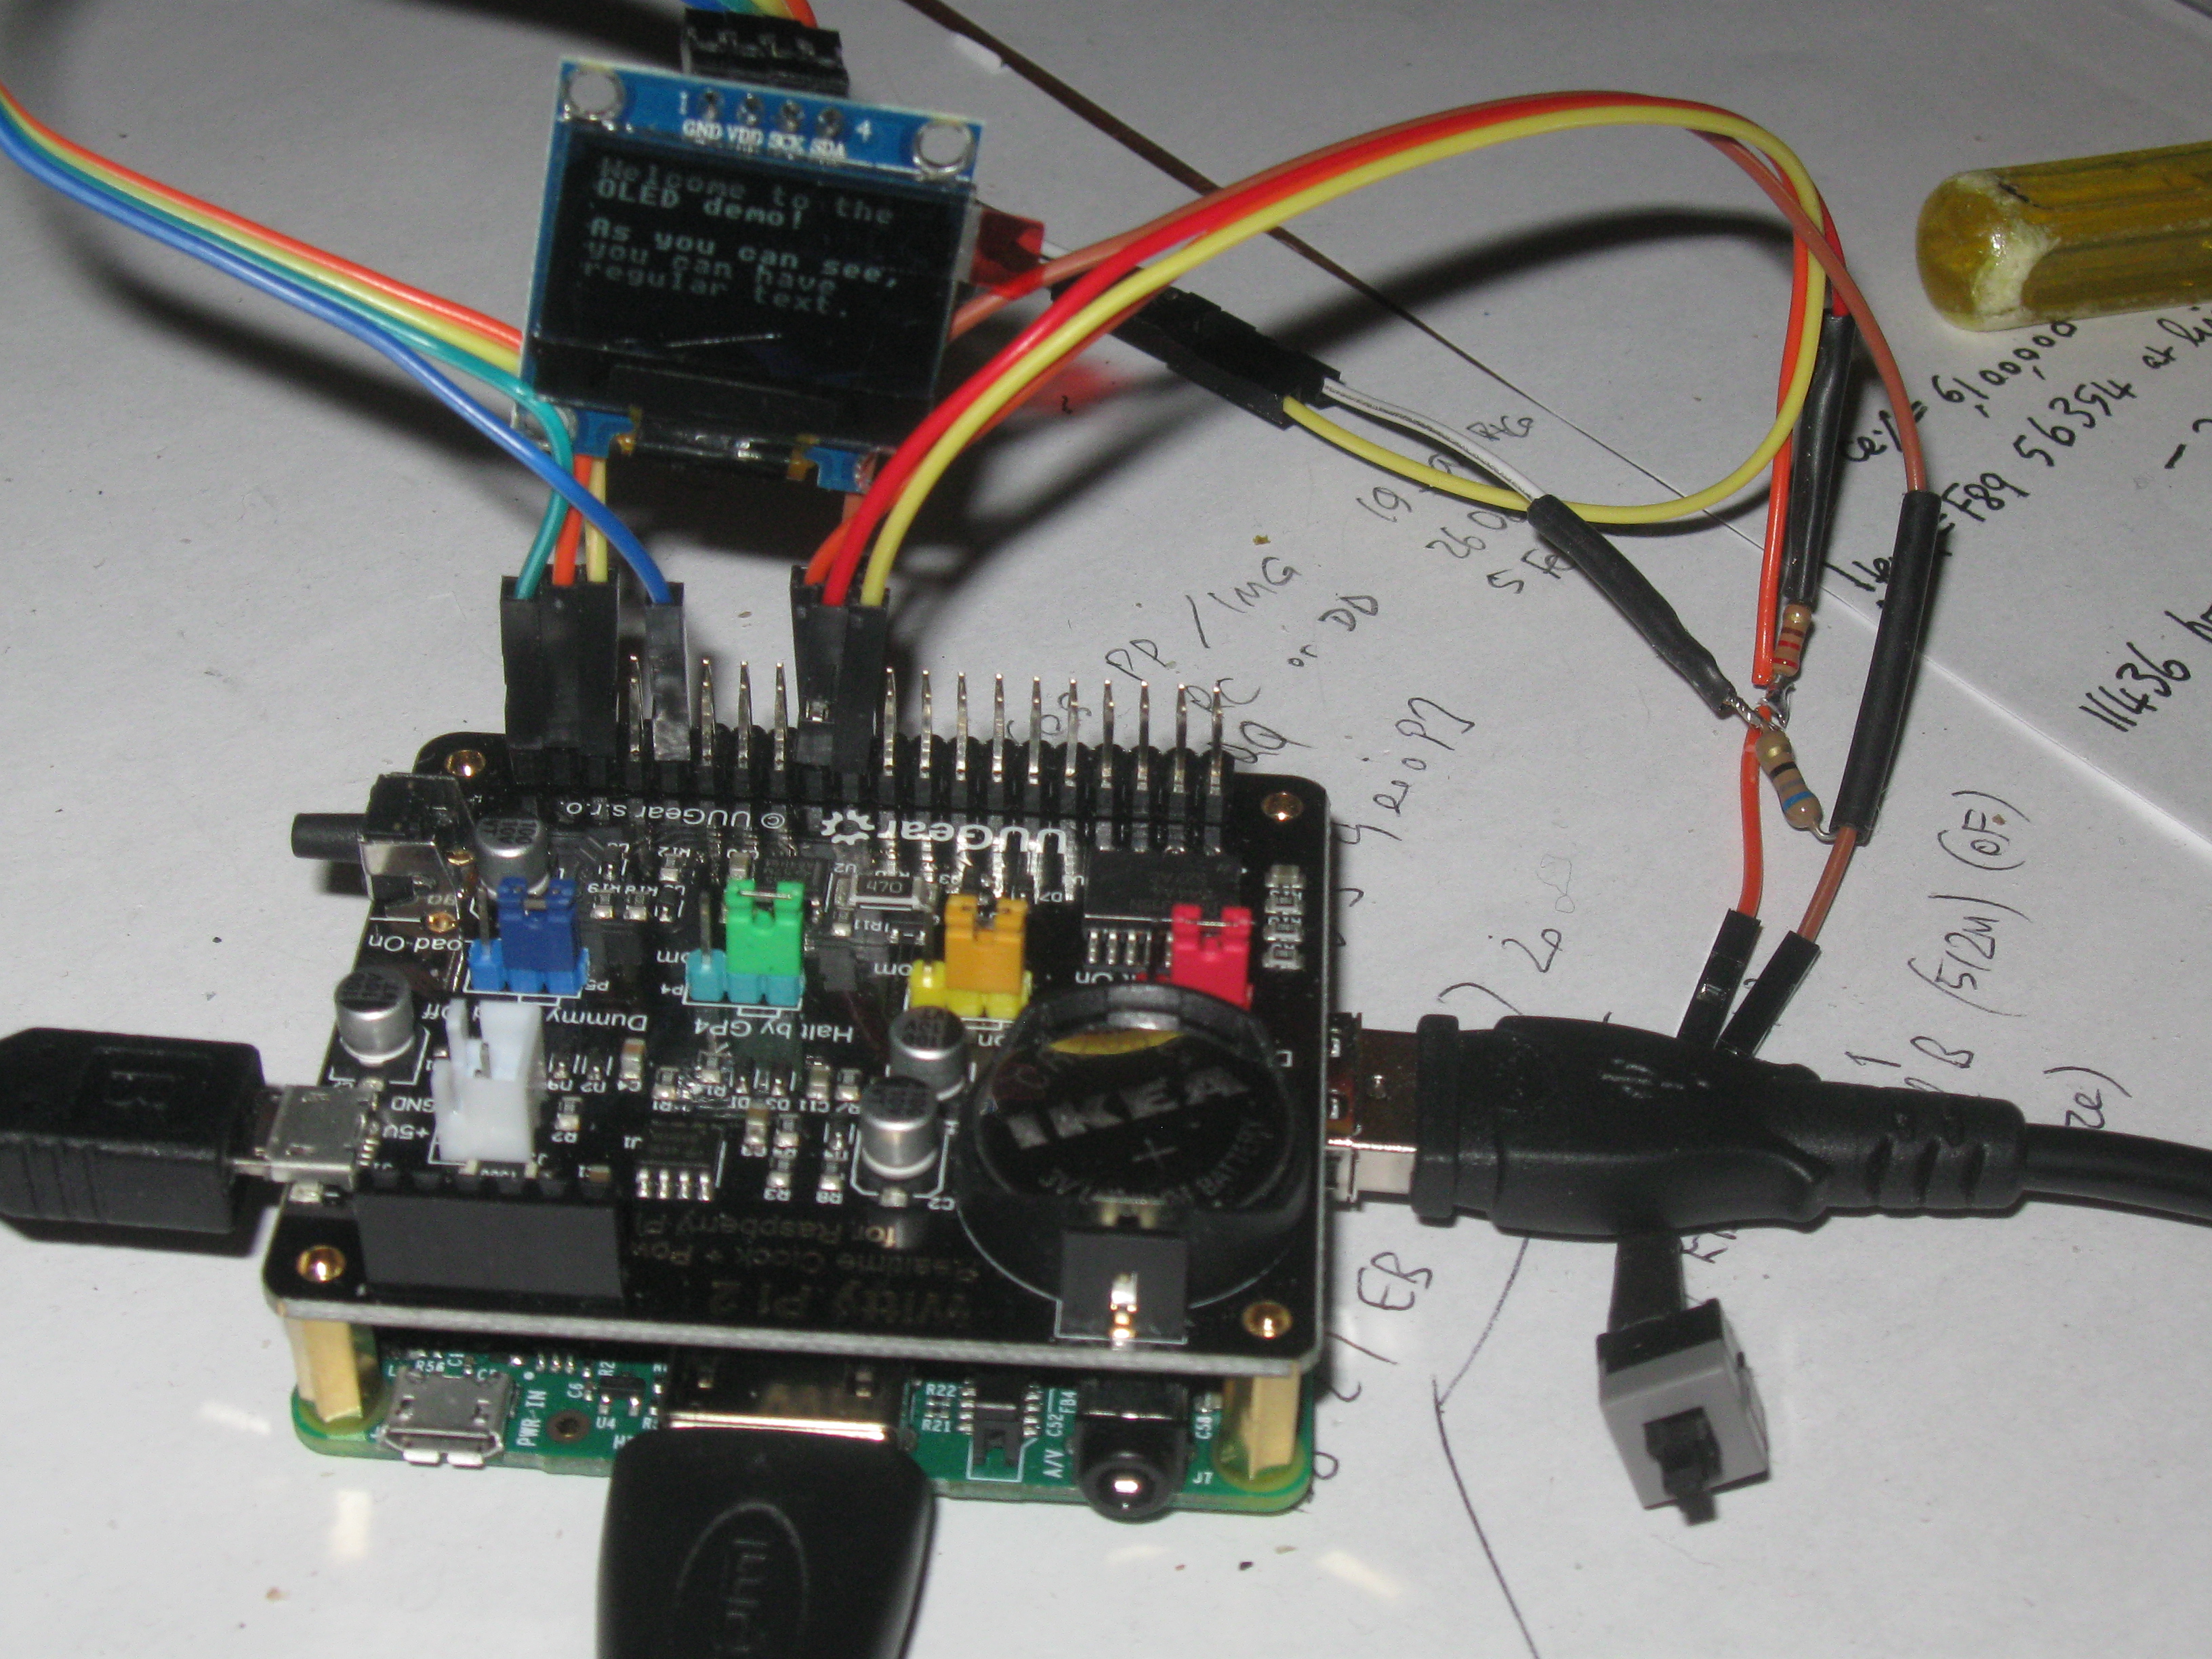
My test set-up: a Raspberry Pi model A+ with a Witty Pi 2 on top. An OLED display is attached to the IIC pins and a switch and LED to the GPIO pins. Power is controlled by the Witty Pi board.
Using GPIO to shut down
Work for the Raspberry Pi Pico build has included the necessary work on the HAL (so far, for the Pi only) to support a generic GPIO module for the ROM. So I built a ROM for the Pi which included the updated GPIO module - this is available from http://www.svrsig.org/software/Update.htm as Update 8H and I wrote a bit of software to control GPIO4:
 10 gpio%=TRUE
 20 LOCAL ERROR
 30 ON ERROR LOCAL gpio%=FALSE
 40 IF gpio% THEN *RMEnsure GPIO 1.00 Error GPIO Module not present
 50 RESTORE ERROR
 60 IF gpio% THEN
 70  REM Set pin 4 TO OUTPUT high
 80  SYS "GPIO_ReadOE",4 TO pin4%
 90  IF pin4%=0 THEN PRINT "Pin 4 is currently an output"
 100  IF pin4%=1 THEN PRINT "Pin 4 is currently an input"
 110  SYS "GPIO_WriteData",4,1:REM Set pin 4 to HIGH
 120  SYS "GPIO_WriteOE",4,0:REM set pin 4 to output
 380  PRINT "Press SPACE bar to turn computer OFF and it will then turn on"
 390  PRINT "when alarm 1 goes off"
 400  REPEAT
 410    IF INKEY(-99) THEN
 420      SYS "GPIO_WriteData",4,0
 430    ELSE
 440      SYS "GPIO_WriteData",4,1
 450    ENDIF
 460  UNTIL 0
 470 ELSE
 480  PRINT "GPIO module not present"
 490 ENDIF
 500 END
Well this worked so I then wrote some software to read the clock registers, using IIC, and set the alarm 1 setting to 10 minutes hence (ignoring, for the moment, what happens at midnight).
 130 DIM mem% 32 , iic% 48
 140 !iic%=&20D0:REM write reg add (00)
 150 iic%!4=mem%
 160 iic%!8=1
 170 ?mem%=0
 180 iic%!12=&20D1:REM read from 00 on
 190 iic%!16=mem%+4
 200 iic%!20=6:REM read the 6 'timenow'
 210 SYS "OS_IICOp",iic%,2
 220 REM time now is (00) sec (BCD)
 230 REM (01) min (BCD) (02) hr (BCD)
 240 REM (04) day of month (BCD)
 250 REM Alarm 1 is (07..0A) for same
 260 mem%?5=(mem%?5)+&10
 265 IF mem%?5>&59 THEN mem%?5=(mem%?5) AND &F:mem%?6=mem%?6+1
 270 mem%?7=mem%?8
 280 !iic%=&20D0:REM write to (07..)
 290 iic%!4=mem%+3
 300 iic%!8=5:REM add plus 4 bytes
 310 mem%?3=7:REM address (07)
 320 iic%!12=&20D0:REM write to (0E)
 330 iic%!16=mem%+9
 340 iic%!20=2:REM add plus 1 byte
 350 mem%?9=14:REM add (14)
 360 mem%?10=5:REM Alarm 1 EN, INT EN
 370 SYS "OS_IICOp",iic%,2
Now it would start up, with the correct time as RISC OS could read the RTC with no trouble, it would set alarm 1 to 10 minutes hence and then offer to switch off when I pressed the space bar.
It would then turn on ten minutes later. This proved that the method would work.
The Witty Pi board is available from #digitalmeans at £34.74 (P&P included) or from the manufacturers (uugear in Czechoslovakia) direct at £15.36 plus either £4 P&P (1 to 4 weeks) or £21.18 P&P (2 days). It is the same size as a model A+ and simply clips onto it, having a female socket below and a 40 pin header above.
Now ‘proof of concept’ to ‘useful’
I wanted to add the ability to turn on and off to my application SatNav. It is surprisingly difficult to fault find on an application that turns itself off (the easy bit) and then relies upon external hardware to turn itself on again.
The ‘proof of concept’ stage just involved working out how to set ‘alarm 1’ to ten minutes hence (which turns the Pi back on) and how to set GPIO pin 4 low (which turns the Pi off).
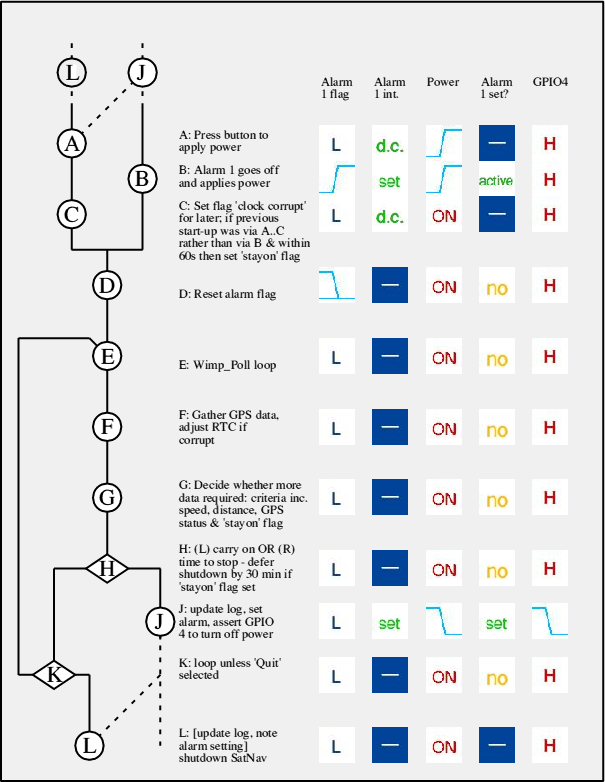
Flow chart.
Complication began to set in. When the computer turns on (from alarm 1 going off) alarm 1 remains active so that although the next ‘turn off’ works, neither the alarm going off again nor the PCB push button can turn it on again! The alarm needs to be reset after any start up in case it is still active. I then realised that a useful hardware override would be a push button forcing the Pi to power up.
More complication: on a computer with no user intervention, an on-screen error box is no use! Also if the application gets confused then you can’t just restart it.
Now what?
After these hurdles I managed to set it up so that it would start up, read where it was last from a log file, look for a satellite position and if it was still at the same place, shut down again. With the ‘wake up’ time set 1 minute hence, I was able to measure the current consumption as 52mAh per hour - it used about 2mAh each time it started up.
It took 16s from power on to full desktop and a further time of between 1s and 15s to get a fix. Normal current consumption (with HDMI active) was 540mA so just this simple method had saved power tenfold.
I could now monitor it with a power consumption meter in the input to see how many startups were taking place. This meant I didn't have to stare at the computer! However after around 10 start ups on auto-pilot, something would get confused and the 'power on/off' button on the Witty Pi PCB would become unresponsive.
After some more logging, I decided that the cause here was that if the alarm flag was set when you asked it to shut down, then when either the alarm went off, or if you pressed the on/off button on the PCB, nothing would happen as it was already 'set'. The solution was to ignore the push button on the PCB and to add a push button which simply bypassed the Witty Pi and applied power to the Pi's 5V rail. The Witty Pi would then continue to provide power when you released the push button - the only problem that seemed to occur was that sometimes this could corrupt the real time clock on the Witty Pi. As it is possible to tell that power has been applied manually (the alarm flag is not set) then the correct time from the GPS can be used to refresh the real time clock on the Witty Pi.
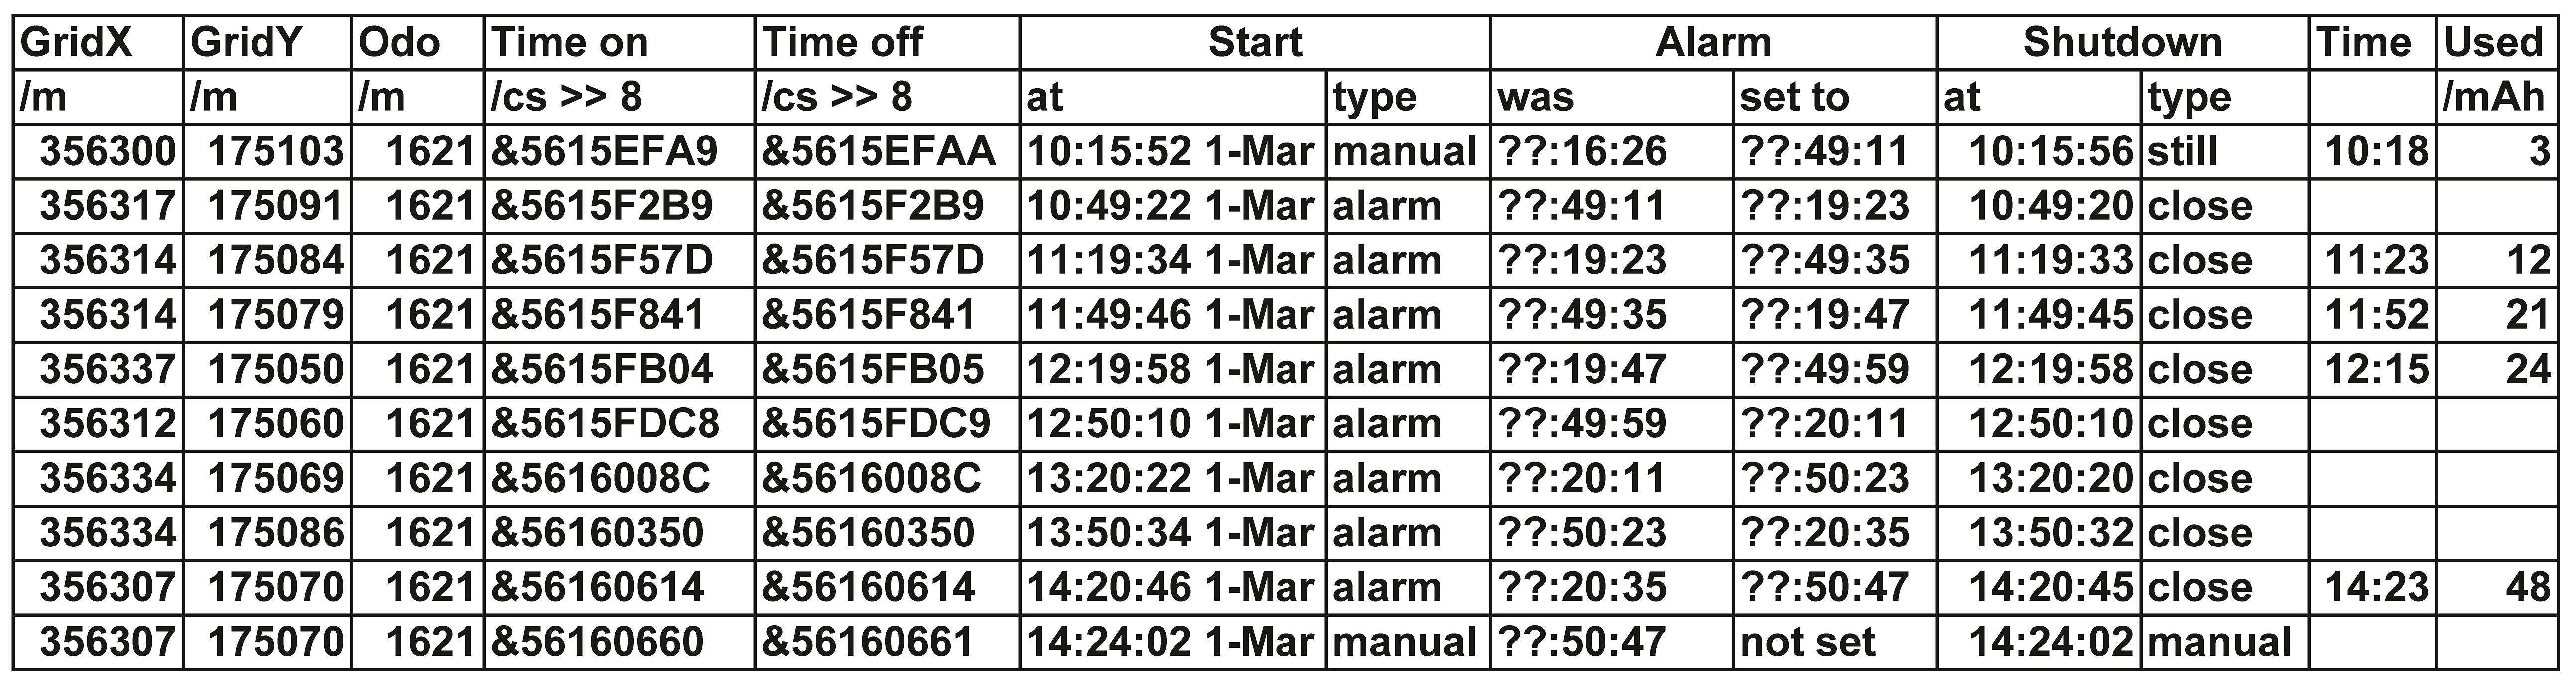
Log entries during the testing: you can see that it takes 11s after the alarm goes off (which applies power) for the desktop and !SatNav to be up and running. With no fix it shuts down after 2� mins but if there is a fix, close to where its last logged position was or still where its last logged position was, it shuts down after only a few seconds (note that the ‘Start at’ time is direct from the RTC but the ‘Shutdown at’ time uses the 5-byte time with the low byte zero). The manual start up (last line) can corrupt the RTC on the Witty Pi if it is shutdown (to extract the log entries) before allowing it to be corrected at the next GPS reading (the RTC on the GPS Hat is unaffected and is updated anyway from the GPS signal). The odometer is only incremented after movement of at least 20 metres so here remains at 1621m. The practical error in GPS reading, with a poor view of the satellites from a window cill, can be seen as ±20m or so, but the accuracy improves quickly to about ±5m during movement, during which the computer is not switched off so quickly.
There are some overheads which are unavoidable: whilst the real time clock is supplied with a few micro amps from a watch battery (this has a capacity of 225mAh and has a life of several years), there is a small standby current consumed by the Witty Pi: 1mA (with the dummy load inactive) or around 8mA (data sheet says 15mA) with it active. There is also the overhead of starting up every 30 mins or so to take a GPS reading.
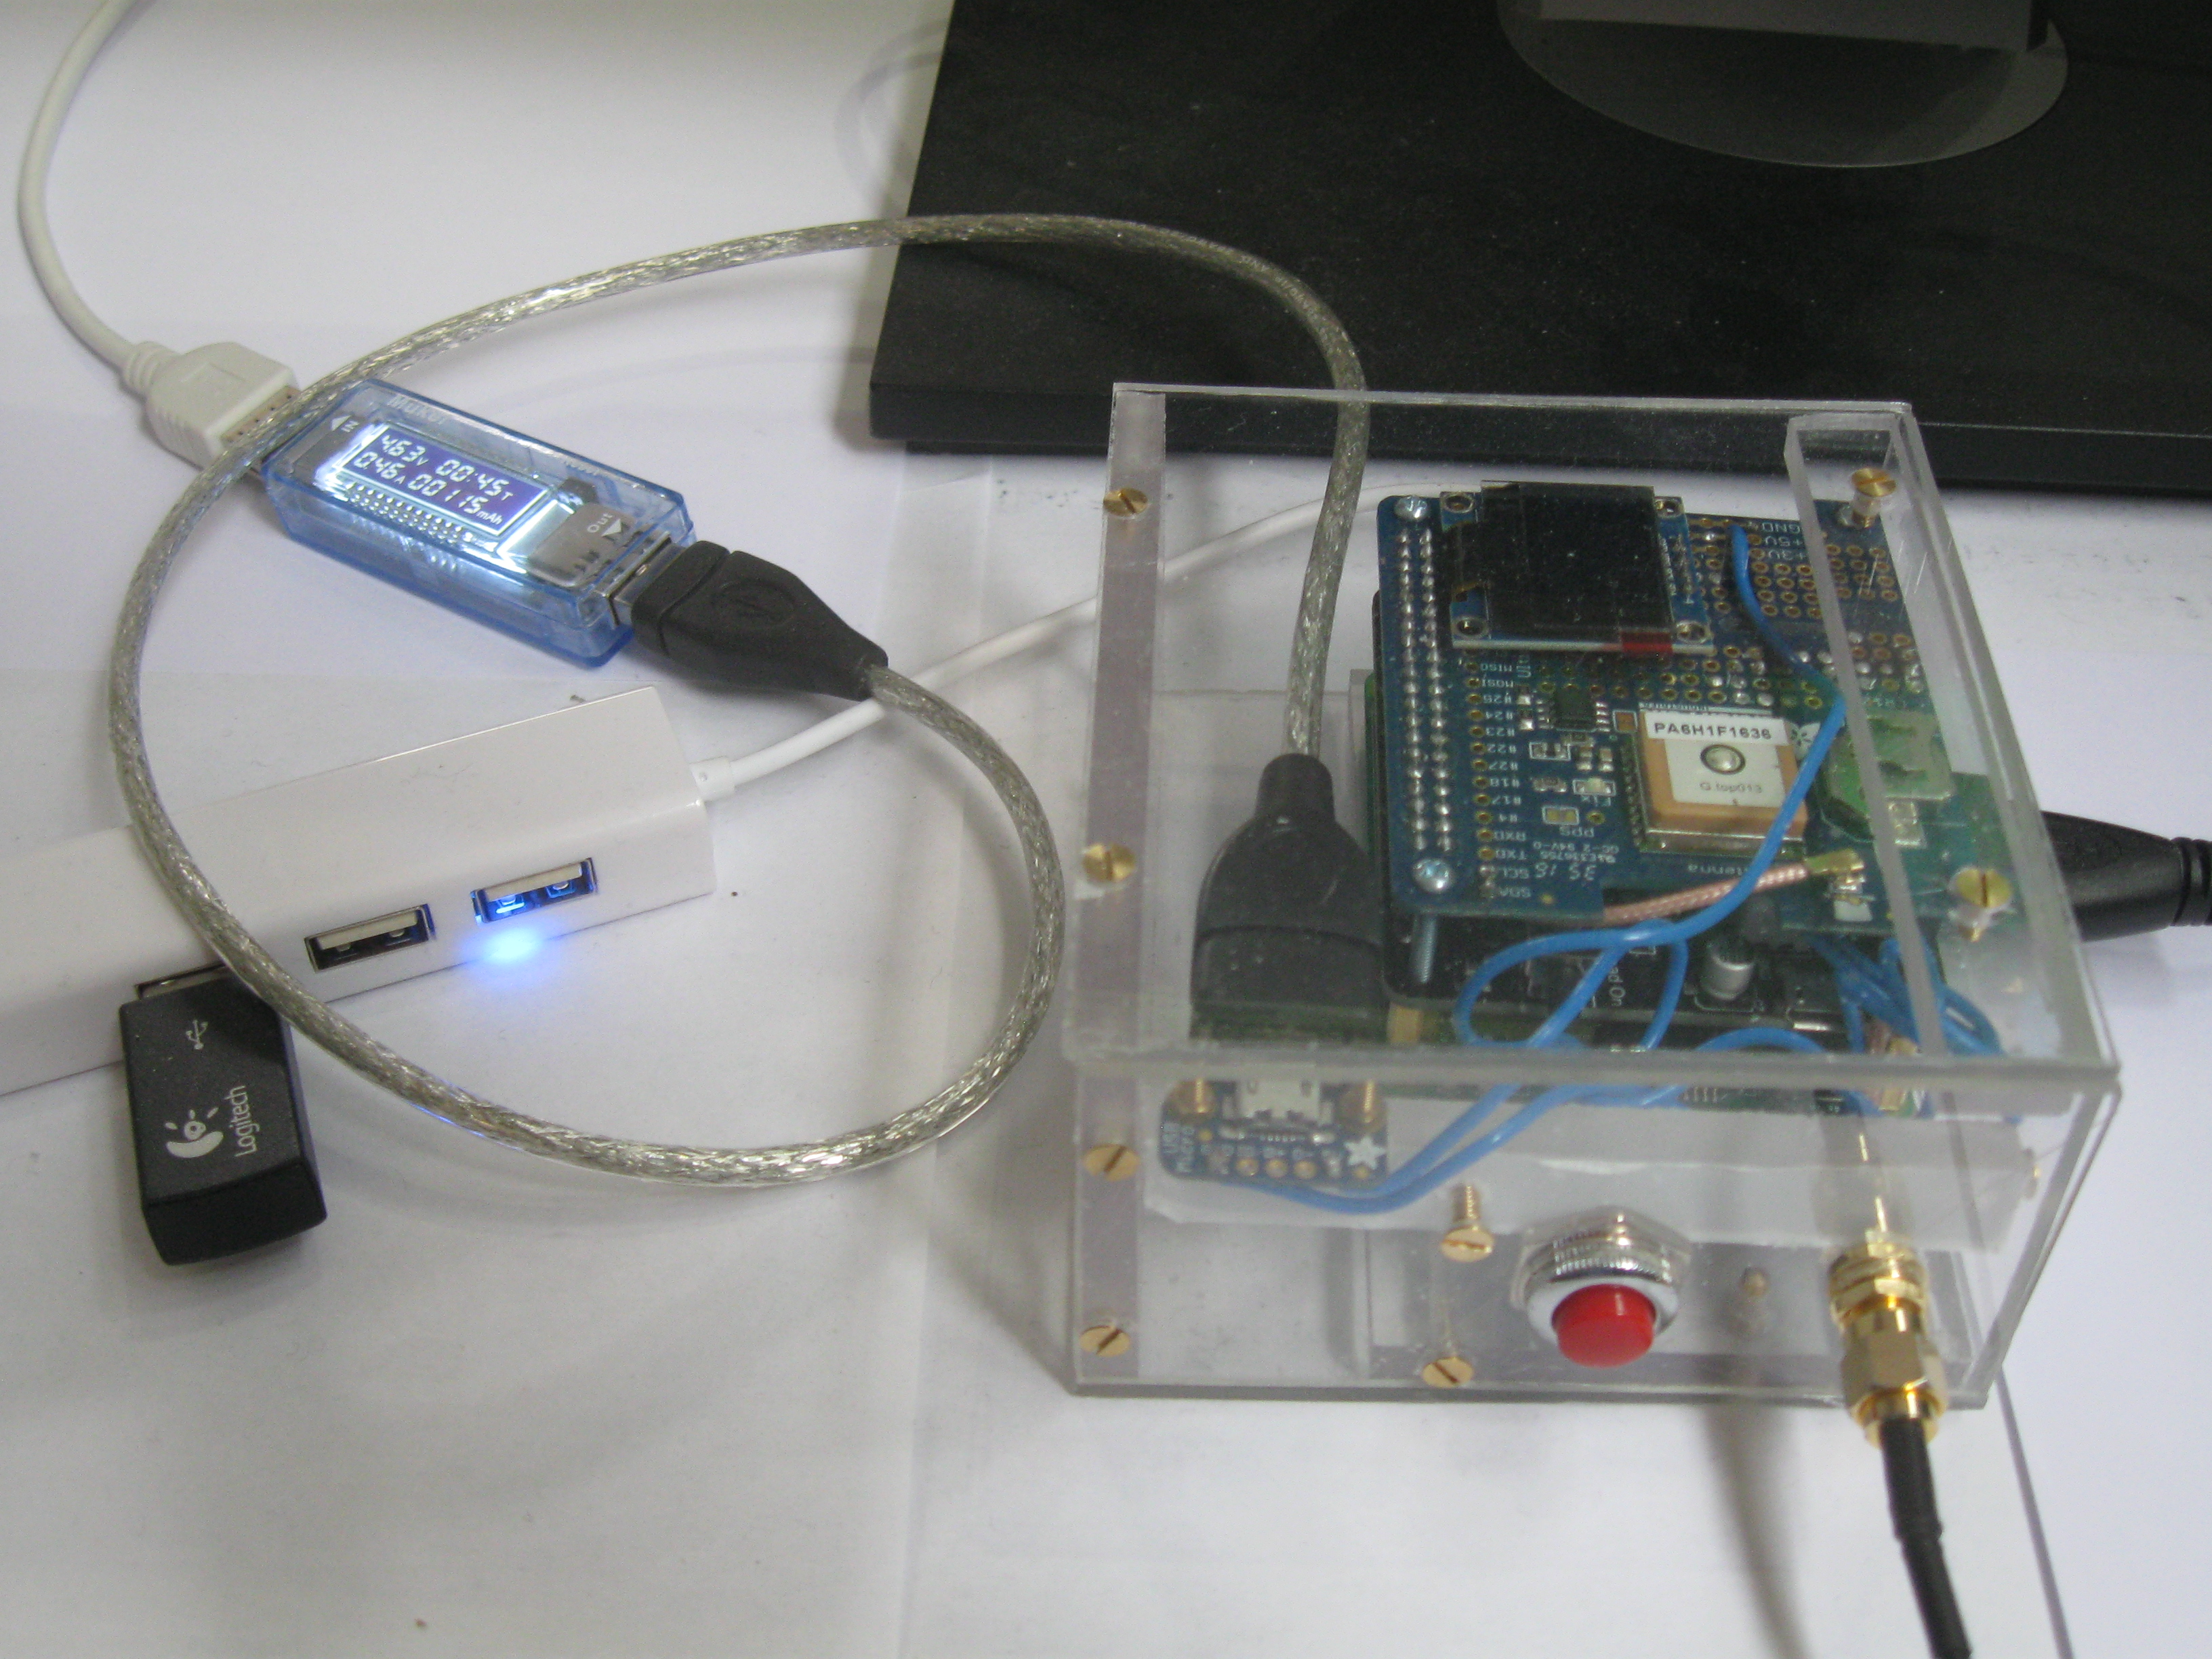
My second test set-up - a mains power supply replaces the battery and has a power meter connected. USB and HDMI are both in use for debugging and an external GPS antenna is connected.
The results of some testing (with a 30 min restart time) were that it consumed power at the rate of 12mAh/h. This would mean that a 5000mAh battery should last about two weeks. If the Pi was continually on, then it would last about 10 hours.
The practical effect of this is that with a battery change every fortnight (possibly more often if the locomotive is used each day) the device can monitor the distance covered by a locomotive (which has no electrical power supply). The push button allows the device to be started manually if not yet scheduled to start. Adjusting the parameters in the programme would allow it to act as a speedometer (staying on rather than turning off whilst it detects movement) which is what it was originally designed to do.
I now had a Raspberry Pi that would shut down as soon as it had a GPS fix and automatically turn itself on again after a pre-determined interval, usually about 30 minutes. The down side of this was that there was only a brief interval where anything could be displayed.
It's all very well to have a computer that only turns on for brief periods but can you display anything useful whilst turned off? In this case there is a good reason to do so, to indicate that it will turn on again at a particular time or when the user presses the button.
I heard that there was a type of display that would retain its displayed information with no external power supply called ‘electronic ink’, such as is used on the Kindle reader. Searching for this on-line brought up a circuit board which had been crowd-funded for the Raspberry Pi in 2015 called the PaPiRus, which could drive a small e-ink display (which are available in various sizes).
Adding an e-Ink display
The PaPiRus would retain a display whilst switched off and thus be ideally suited to this project. It was controlled by the SPI (Serial Peripheral Interface) bus, and my first thought was that all I needed was a SPI driver for RISC OS and I could then just send it the display data.
I found that a SPI driver had been written for the ARMX6 and after a few questions found that a PiSPI driver had, separately, been developed for the Raspberry Pi. Quite different approaches had been used for each, the driver for ARMX6, however, exploited particular features of that board.
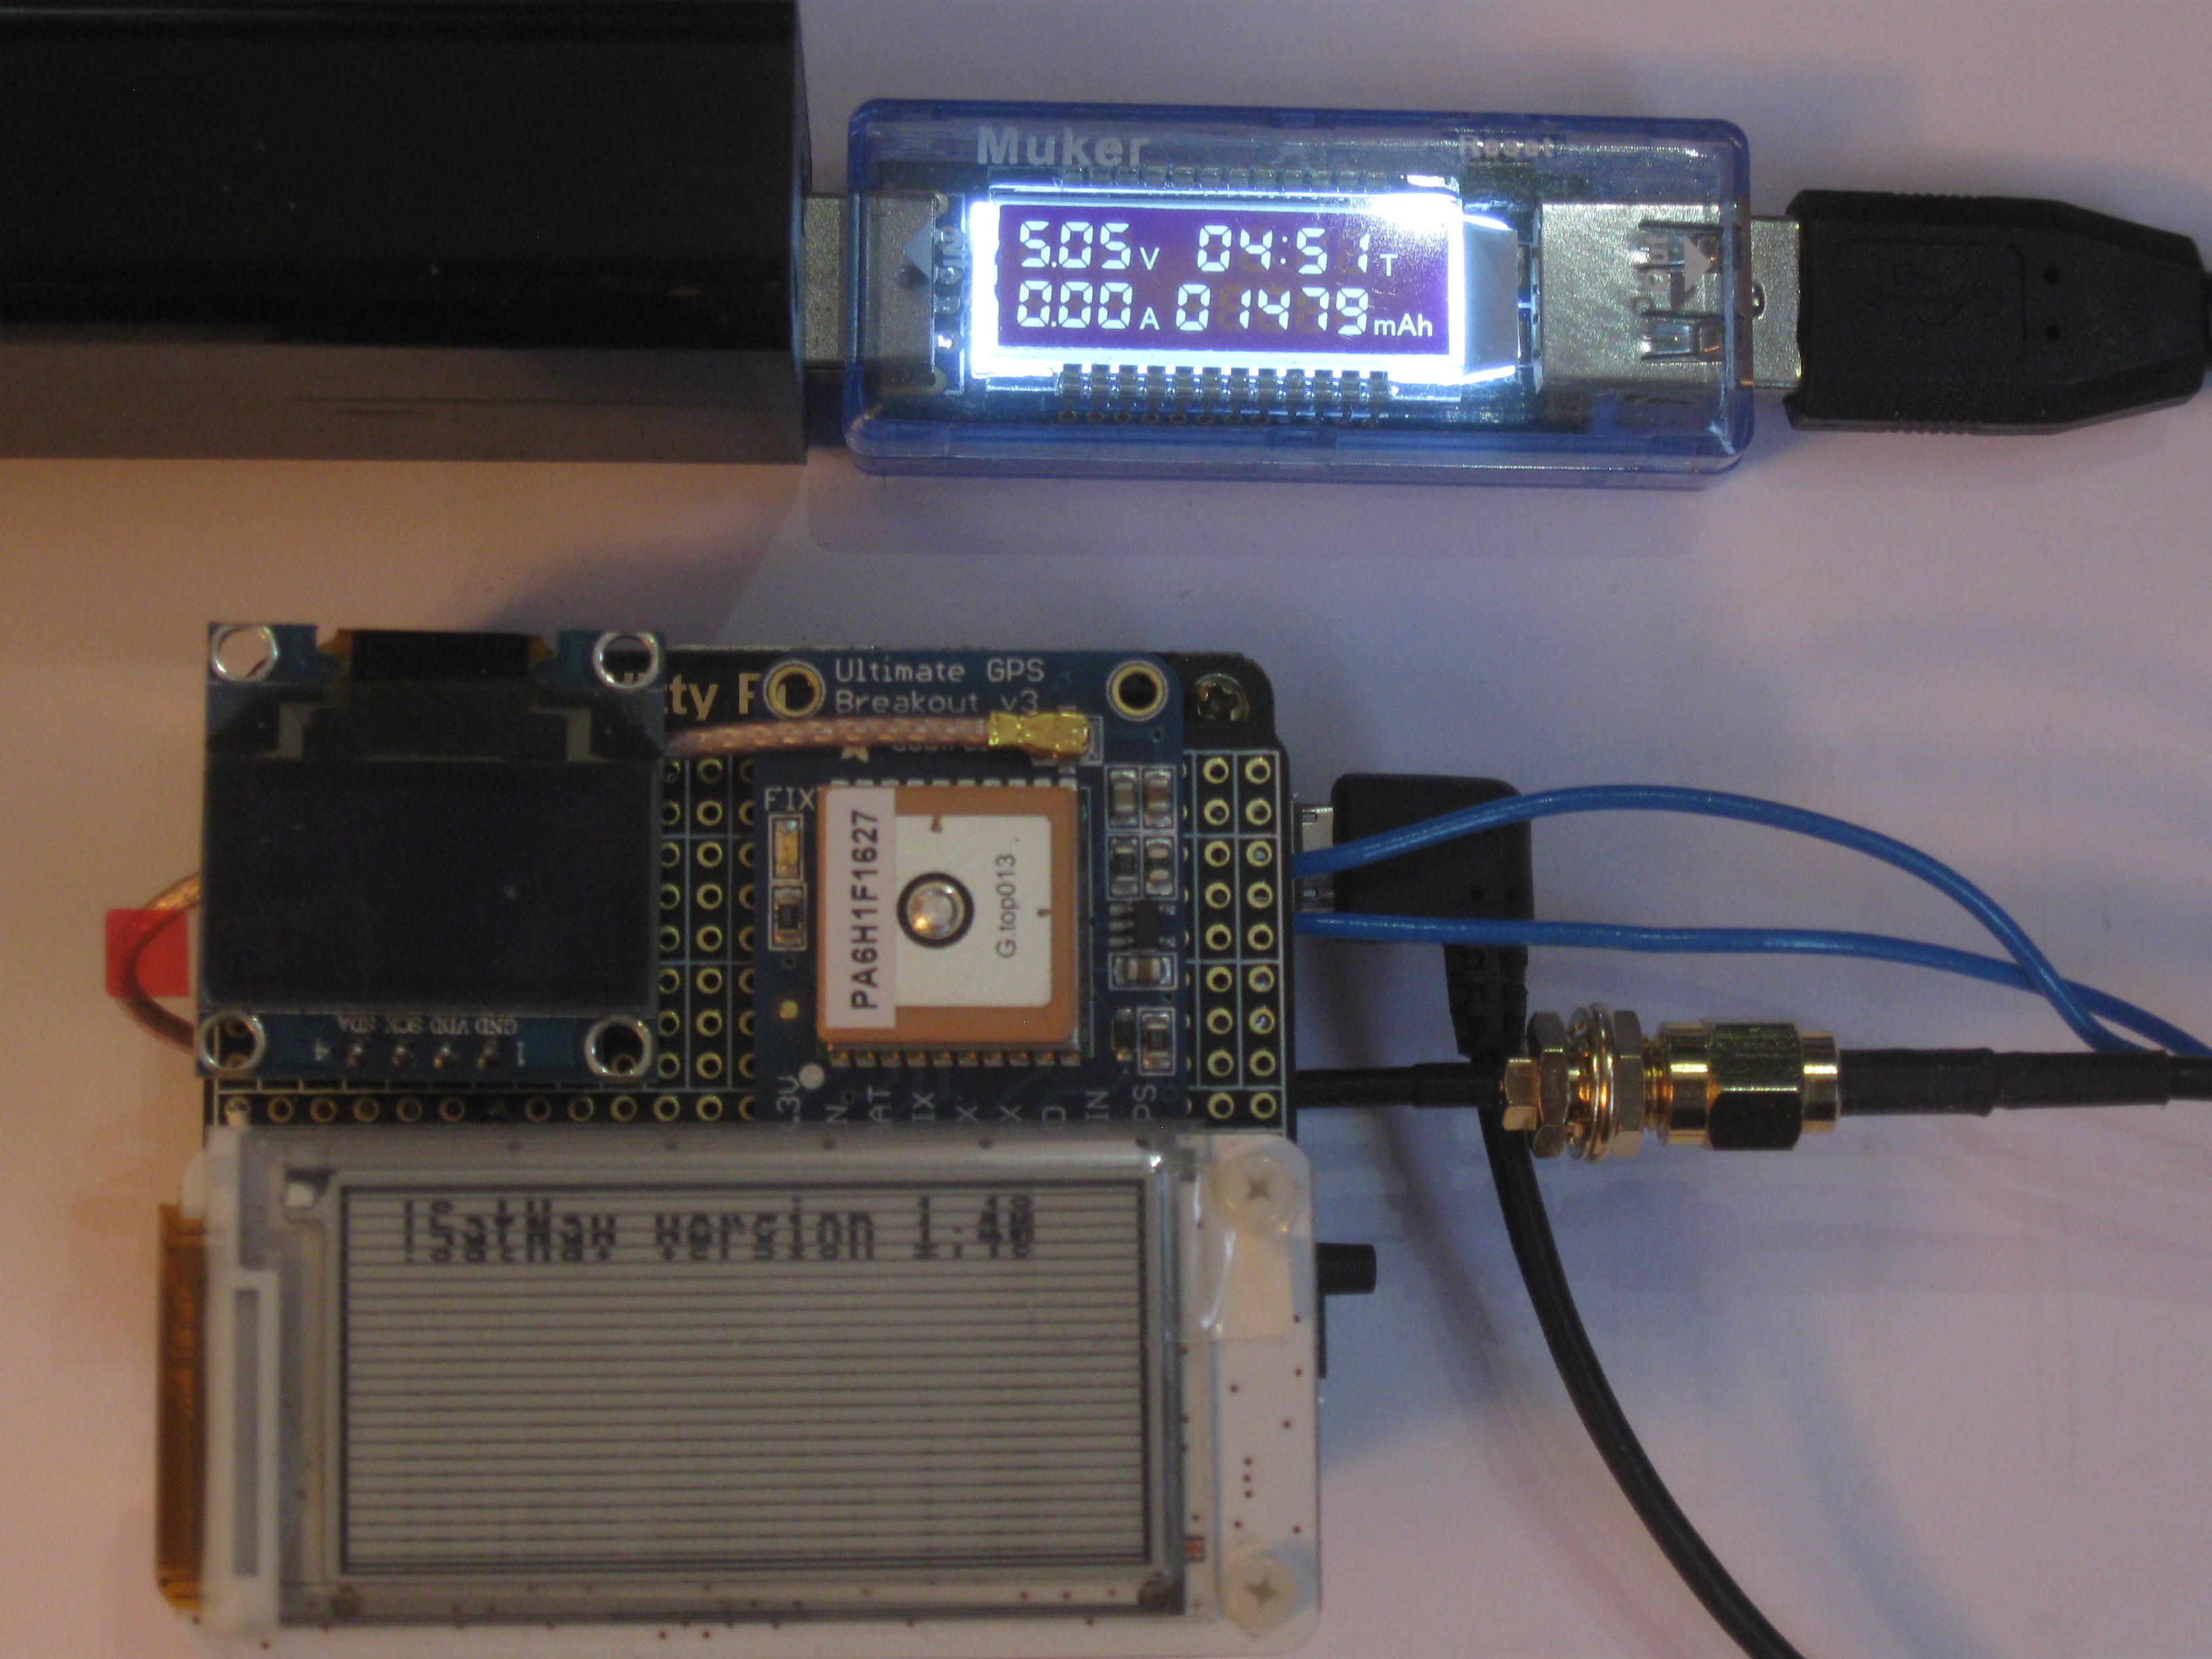
My test set-up: a 5000mAh battery provides power through a power meter to the model A+ Pi, with no USB or HDMI connection (saves power). A GPS module and an OLED display are mounted on a breakout board and the four boards comprise model A+, Witty Pi 2, breakout board and PaPiRus Zero board. The 'enable' pin of the GPS module is wired to GPIO 22 (so that it can be turned off under software control). An external GPS antenna improves the fix time. In the finished version power will be supplied via the blue wires (direct onto a socket on the Witty Pi) with a push button to apply power directly to the Pi's 5V supply so that it can be turned on manually.
Documentation for the PiSPI driver was sparse but the developer, Bill Antonia, was kind enough to provide examples in BASIC of making the necessary calls to the PiSPI module and also provided links to the actual code that drove the display under Linux and to the technical manual for the e-ink display itself. There were some examples, written in Python for Linux, which seemed simple. It also became clear that both GPIO and SPI drivers were needed.
By then (6 March) I had obtained a PaPiRus display and found that it worked perfectly under Linux. I read the Python scripts which drove it (the set up command automatically downloaded these) and they seemed quite simple.
Only when I looked at the Linux software and the manual in detail did I realise that the Python scripts were almost irrelevant and that most of the code that mattered was hidden away somewhere on github and was very complicated.
I am now quite pleased to report that by the early hours of 11th March I had a driver, written in BASIC, that would operate the display. By 13th March I had double checked the code and had a version that would read back correctly from SPI as well as operate on a computer that had a GPS module operating.
Conflict on the serial port
This conflict was just an extra complication as both the GPS module and the PaPiRus display use the RXDATA and TXDATA pins for completely different and incompatible purposes. I found that the PaPiRus display happily tolerated serial data appearing on the RXDATA pin as the ‘panel on’ pin (BCM 23) was in its default state (inactive) and thus the ‘discharge’ pin (BCM 15) was ignored.
In order to use the PaPiRus display (which used BCM 14 and 15 to control itself) I had to disable the GPS module (which turns off the satellite tracking and serial data communication and removes any pulsing on the RXDATA pin) and set those pins to GPIO outputs while I updated the e-ink display. Getting the serial port back afterwards - i.e. returning the RXDATA and TXDATA pins to UART control - has so far proved too difficult.
My failed attempt to breathe life back into the serial port ‘SerTest’ is on the monthly disc - any ideas on making it work would be welcome:
   10 REM >SerTest
   20 :
   30 REM Need to disable GPS
   40 SYS "GPIO_WriteData",22,1
   45 REM Set pin 22 to HIGH
   50 SYS "GPIO_WriteOE",22,0
   55 REM set pin 22 to output
   60 SYS "GPIO_WriteData",22,0
   65 REM Set pin 22 to LOW
   70 :
   75 REM Set TXDATA/RXDATA to GPIO use
   80 SYS "GPIO_ReadOE",15 TO pin15%
   90 SYS "GPIO_WriteData",15,0
  100 SYS "GPIO_WriteOE",15,0
  110 :
  120 SYS "GPIO_ReadOE",14 TO pin14%
  130 SYS "GPIO_WriteData",14,0
  140 SYS "GPIO_WriteOE",14,0
  150 :
  155 REM (Now I can update PaPiRus)
  160 :
  165 REM Now try to get serial port
  170 REM functioning again
  175 SYS "GPIO_WriteMode",14,5:REM UART
  180 SYS "GPIO_WriteMode",15,5:REM UART
  190 *fx21,1
  200 SYS "OS_SerialOp",5,3,0
  205 REM Baud rate to slow
  210 REM which flushes buffers
  215 SYS "OS_SerialOp",1,0
  220 REM Set 8bit, 1 stop bit, no parity
  225 SYS "OS_SerialOp",0,&3E
  230 REM Set no handshaking
  235 SYS "OS_Byte",2,2
  240 REM Enable serial input (??)
  245 *FX 21,1
  250 SYS "OS_SerialOp",5,7,0
  255 REM Baud rate to 9600
  260 REM If you send a 'break' (below)
  265 REM then the Pi hangs!!
  270 REM SYS "OS_SerialOp",2,20
  275 REM Use at your peril!
  280 REM Set pin 22 to HIGH to
  285 REM re-enable GPS module
  290 SYS "GPIO_WriteOE",22,1
  295 REM Now let's try the serial port
  300 SYS "OS_SerialOp",4,-1 TO ,r1% ;r2%
  305 PRINT "r1%=-1 => no data"
  310 PRINT "r1%=";r1%
  320 PRINT "(r2% AND 2)=2 => no data"
  330 PRINT "r2%=";r2%
... as I just get r1%=-1 (nothing received) so I am only able to update the PaPiRus display after I have finished with the serial port.
Cheating
I realised that in every case (!) where I was using the PaPiRus display, I had used a breakout board between the display and the rest of the equipment. The solution was therefore to use two different pins to drive the PaPiRus, leaving the serial pins unaffected.
Driving the PaPiRus
I was now using quite a few of the BCM pins on the 40-pin header:
- 7-11 are used for SPI
- 14-15 are used for the UART
- 16, 19-21, 26 are used for the 5 buttons
- 5-6, 23-25 are used to control the board
- 2-3 are used for IIC
- 4 is used to tell Witty Pi to turn off
- 22 is used to turn off the GPS module
- 17-18 are reserved for PaPiRus
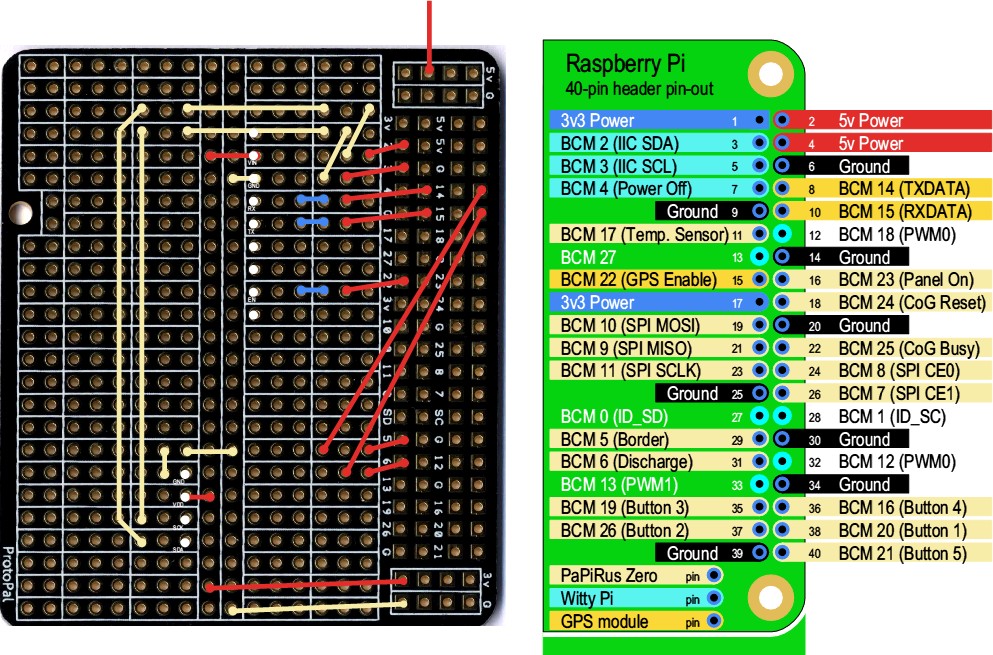
Pinouts for the various boards in the project - there's not much that is not used! ‘CoG’ stands for ‘Chip on Glass’. Pins 8 and 10 are the problem! Here you can see that I have used BCM 5 and 6 instead for the PaPiRus display. The white pins are where the OLED display and the GPS module are connected.
The driver was not perfect - there was slight ghosting on every fourth line - but, no doubt, that would get itself sorted out in due course. For the reasons above, I was only able to update the e-ink display immediately prior to turning off the power - at which point I no longer needed the serial data!
I had chosen a version of the PaPiRus that had no temperature sensor and no real time clock as these would have just added further complication. There were, after all, already two real time clocks on my set-up - one via the GPS signal and one on the Witty Pi!
SatNav does it all
The next step was to add the code to what was now becoming a portmantau application, SatNav, and to decide what to show on the display when the Pi shut down. Thinking of show demonstrations, the obvious thing to say was when it was turned off and when it was set to turn on again, as well as the latest odometer reading.
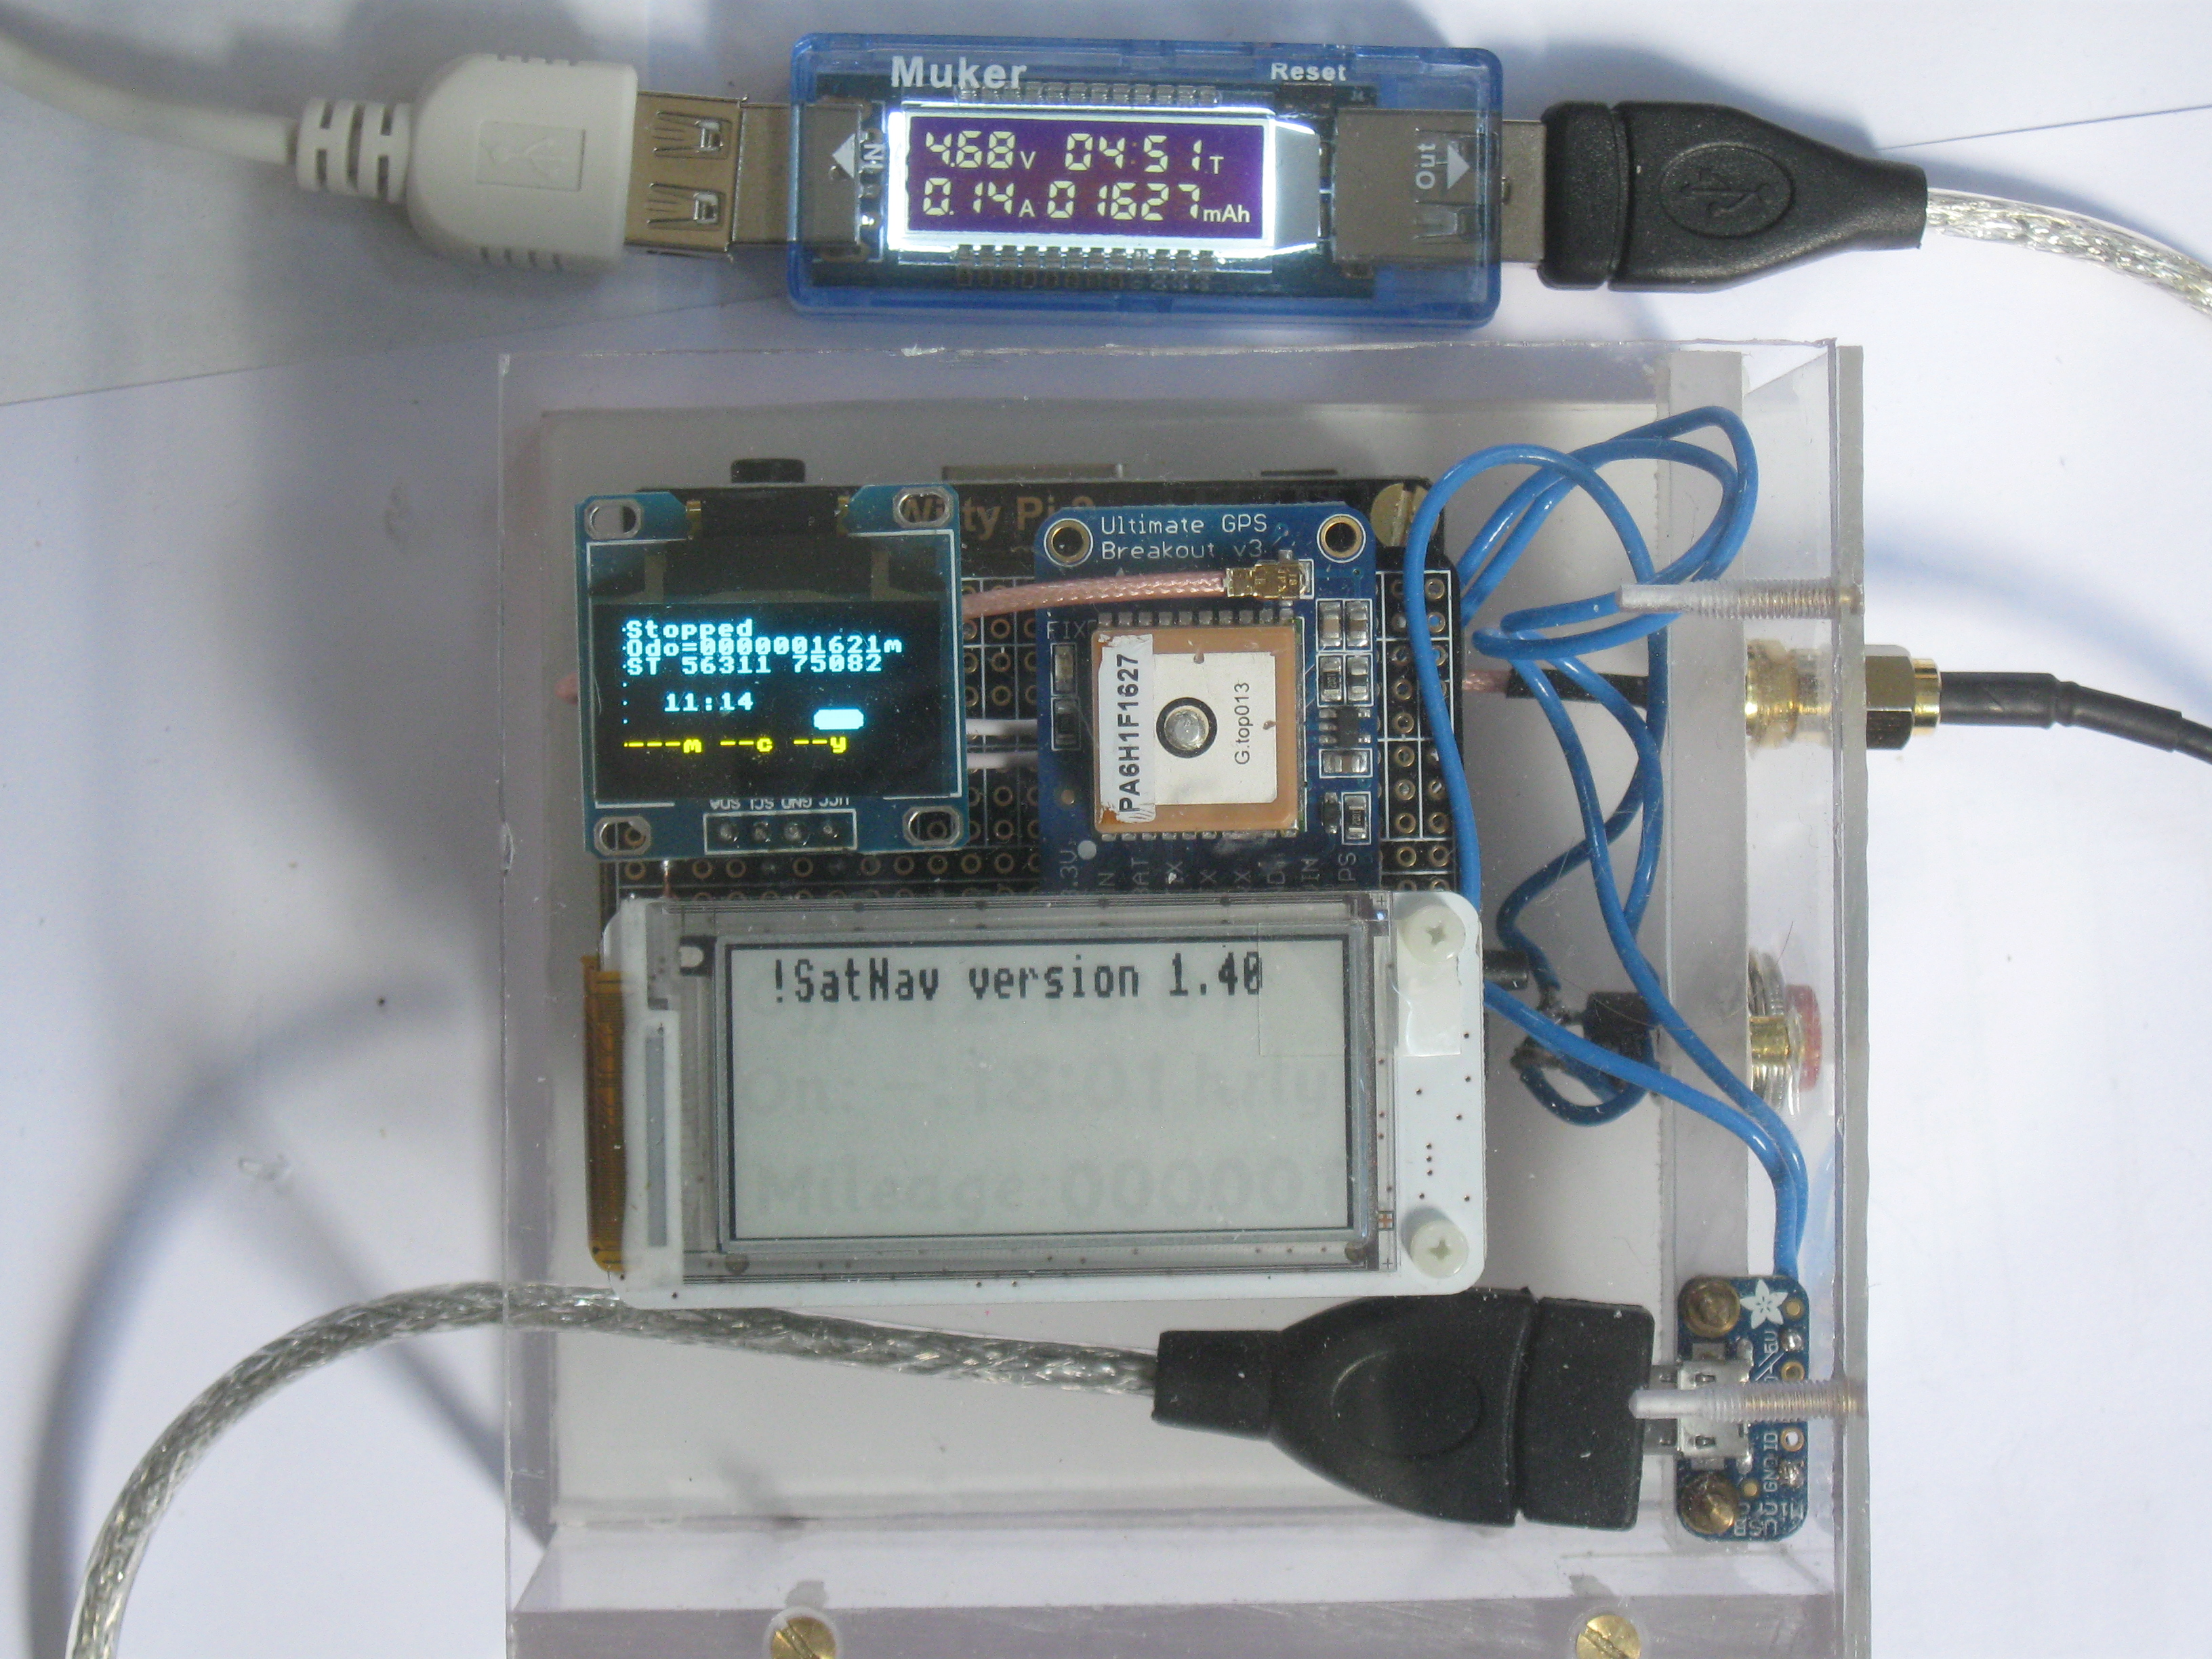
A final demonstration of it all working. The only user intervention is the red button to force power on. The battery has been removed to allow its power consumption to be monitored - the model A+ Pi proved to be the most efficient at 160mA. The PaPiRus display has been updated on power on and the display is now pin-sharp. On power off it will show when it is next scheduled to turn on. The OLED display shows the time and grid reference.
Power consumption
I think it is time to look at the power consumption: after all the reason for this being so complicated was to have the computer on only for short periods, but still track its position.
With no HDMI lead connected and no USB cable connected, the power consumption was about 150mA, which would allow just an OLED display to be used but would exhaust the small 5000mAh battery I was using in about 24 to 30 hours. This would have been OK for a speedometer, with a fresh battery every day.
With a good view of the satellites (placed on an outside window ledge, rather than on an inside window cill) it takes 11s from power on for SatNav to be running, a further 4s to 14s for it to decide it is still where it last was, and then a further 15s to update the PaPiRus display and switch off.
With the interval before power is reapplied set as 5 minutes, the expected power consumption should be reduced by about a factor of 35/335, i.e. 16mA but it turns out to be 19mA as there is about 3mAh per hour consumed by briefly drawing 70mA every 10s or so to keep the power bank happy.
There is a button to force power on manually (i.e. without waiting for the alarm to go off) - it just applies 5V downstream of the switch on the Witty Pi, which notices this and holds the power on. This ‘surge’ usually resets the real time clock on the Witty Pi to January 2100 but this is automatically corrected (by !SatNav) using the real time clock in the GPS module.
At 19mA my battery would now last about 11 days. I could probably extend this a bit by being more intelligent about the 5 minute period - making it longer overnight for example - but I think adjustments like this would have to be in a real prototype.
The messages on the e-ink display on start up (now that it is possible to update the display on start up) could be refined a little.
Milepost mileage
I was concerned that working out the milepost mileage on SVR by starting at one end and calculating the miles and chains from the grid references of the waypoints could introduce cululative errors. For example where there is a gradient of 1 in 100, the miles and chains would lose about 1% - up to 10 to 15 chains in 16 miles.
Fortunately I found that the National Library of Scotland had scanned the 25 inch to the mile Ordnance Survey maps of England (which showed the exact position of mileposts) and these had been ortho-rectified to show precise grid references and so I was able to reduce the error significantly.
Conclusion
So, does it work? Yes. I have uploaded a YouTube video to demonstrate it and there is an animated gif showing it turning on and off.
The accuracy varies between ±3m to ±10m depending on the position of the satellites in the sky (well spread apart: low error) which is quite sufficient, for example, to make useful measurements of the necessary cable length between two locations just by visiting each, rather than by walking with a measuring wheel the length of line between.
Further development
More improvements
Getting the odometer to work reliably has proved surprisingly difficult - the fundamental problem is that when the computer is turned on and the GPS module starts looking for a fix, its first fix is generally obtained using the first four satellites it can track. This is the minimum needed for a valid fix and although the relative position of the satellites in the sky (i.e. whether closely grouped or widely spaced) is used to estimate the degree of uncertainty (which seems to range from ±10m to ±3m if one assumes 'normal' is about ±5m) the likely error is not disclosed. With only four satellites being tracked the actual error can be as high as ±50m. As more satellites are being tracked - with a clear view of the sky around ten satellites will usually be tracked - the actual error reduces.
This has the effect of the GPS fix 'wandering' around up to 30m just after power is applied and before the accuracy of the fix improves as more satelites are seen during which there may be little or no actual movement. Although ground speed may drift up to 1 or 2 mph during this phase, it does not affect the speedometer function in any significant way. The odometer is another matter. My first method was to ignore movement up to 30m from the last recorded position but this still meant that the odometer tended to accumulate movement entirely from measurement error. This was exacerbated by the power-on, power-off used to extend the battery life.
An improved method now takes the average of each GPS fix until the average position has moved more than 50m from the last recorded position. This appears to reduce the random error significantly - accuracy improves quickly after a few seconds as more satellites are seen. Testing of this method has been done by stepping along the SVR at an adjusted line speed with station stops and with a 20m random error superimposed on the calculated position. In practice a trip from Kidderminster (135m28c5y) to 135m21c to 138m26c=137m12c9y to Bridgnorth (150m6c21y) is 16m6c17y=25885.8m and the odometer went from 8939m to 34837m, i.e. 25898m so that's pretty good agreement! Note there are two milepost mileage discontinuities: one where it changes from counting down to counting up, in both directions, near Kidderminster Junction and one where there is an 'overlap' between Bewdley South and 1 mile and 9 chains each side of it.
The logging of a journey originally used a rather obscure format, mainly designed to help debugging, but I have changed it to use the Anquet AEF file format so that a logged journey can be loaded directly into mapping software. This also allows a journey to be ‘played back’ after the event.
Another addition, particularly for the development phase, is to add a few extra buttons: so far there is a single button which forces power on. The software itself decides whether to power off. Adding a button which shuts down the !SatNav application and powers off the computer - as if it had decided that no movement was taking place - is relatively innocuous. Another button that would force power off immediately is a less obvious need (useful if the software crashes for example but it would leave the logging file incomplete) but it can easily be added. Assuming that a ‘download’ facility might be needed, a further button which would download the log to a USB pen drive can also be added. Developing a bluetooth or WiFi solution is currently too difficult.
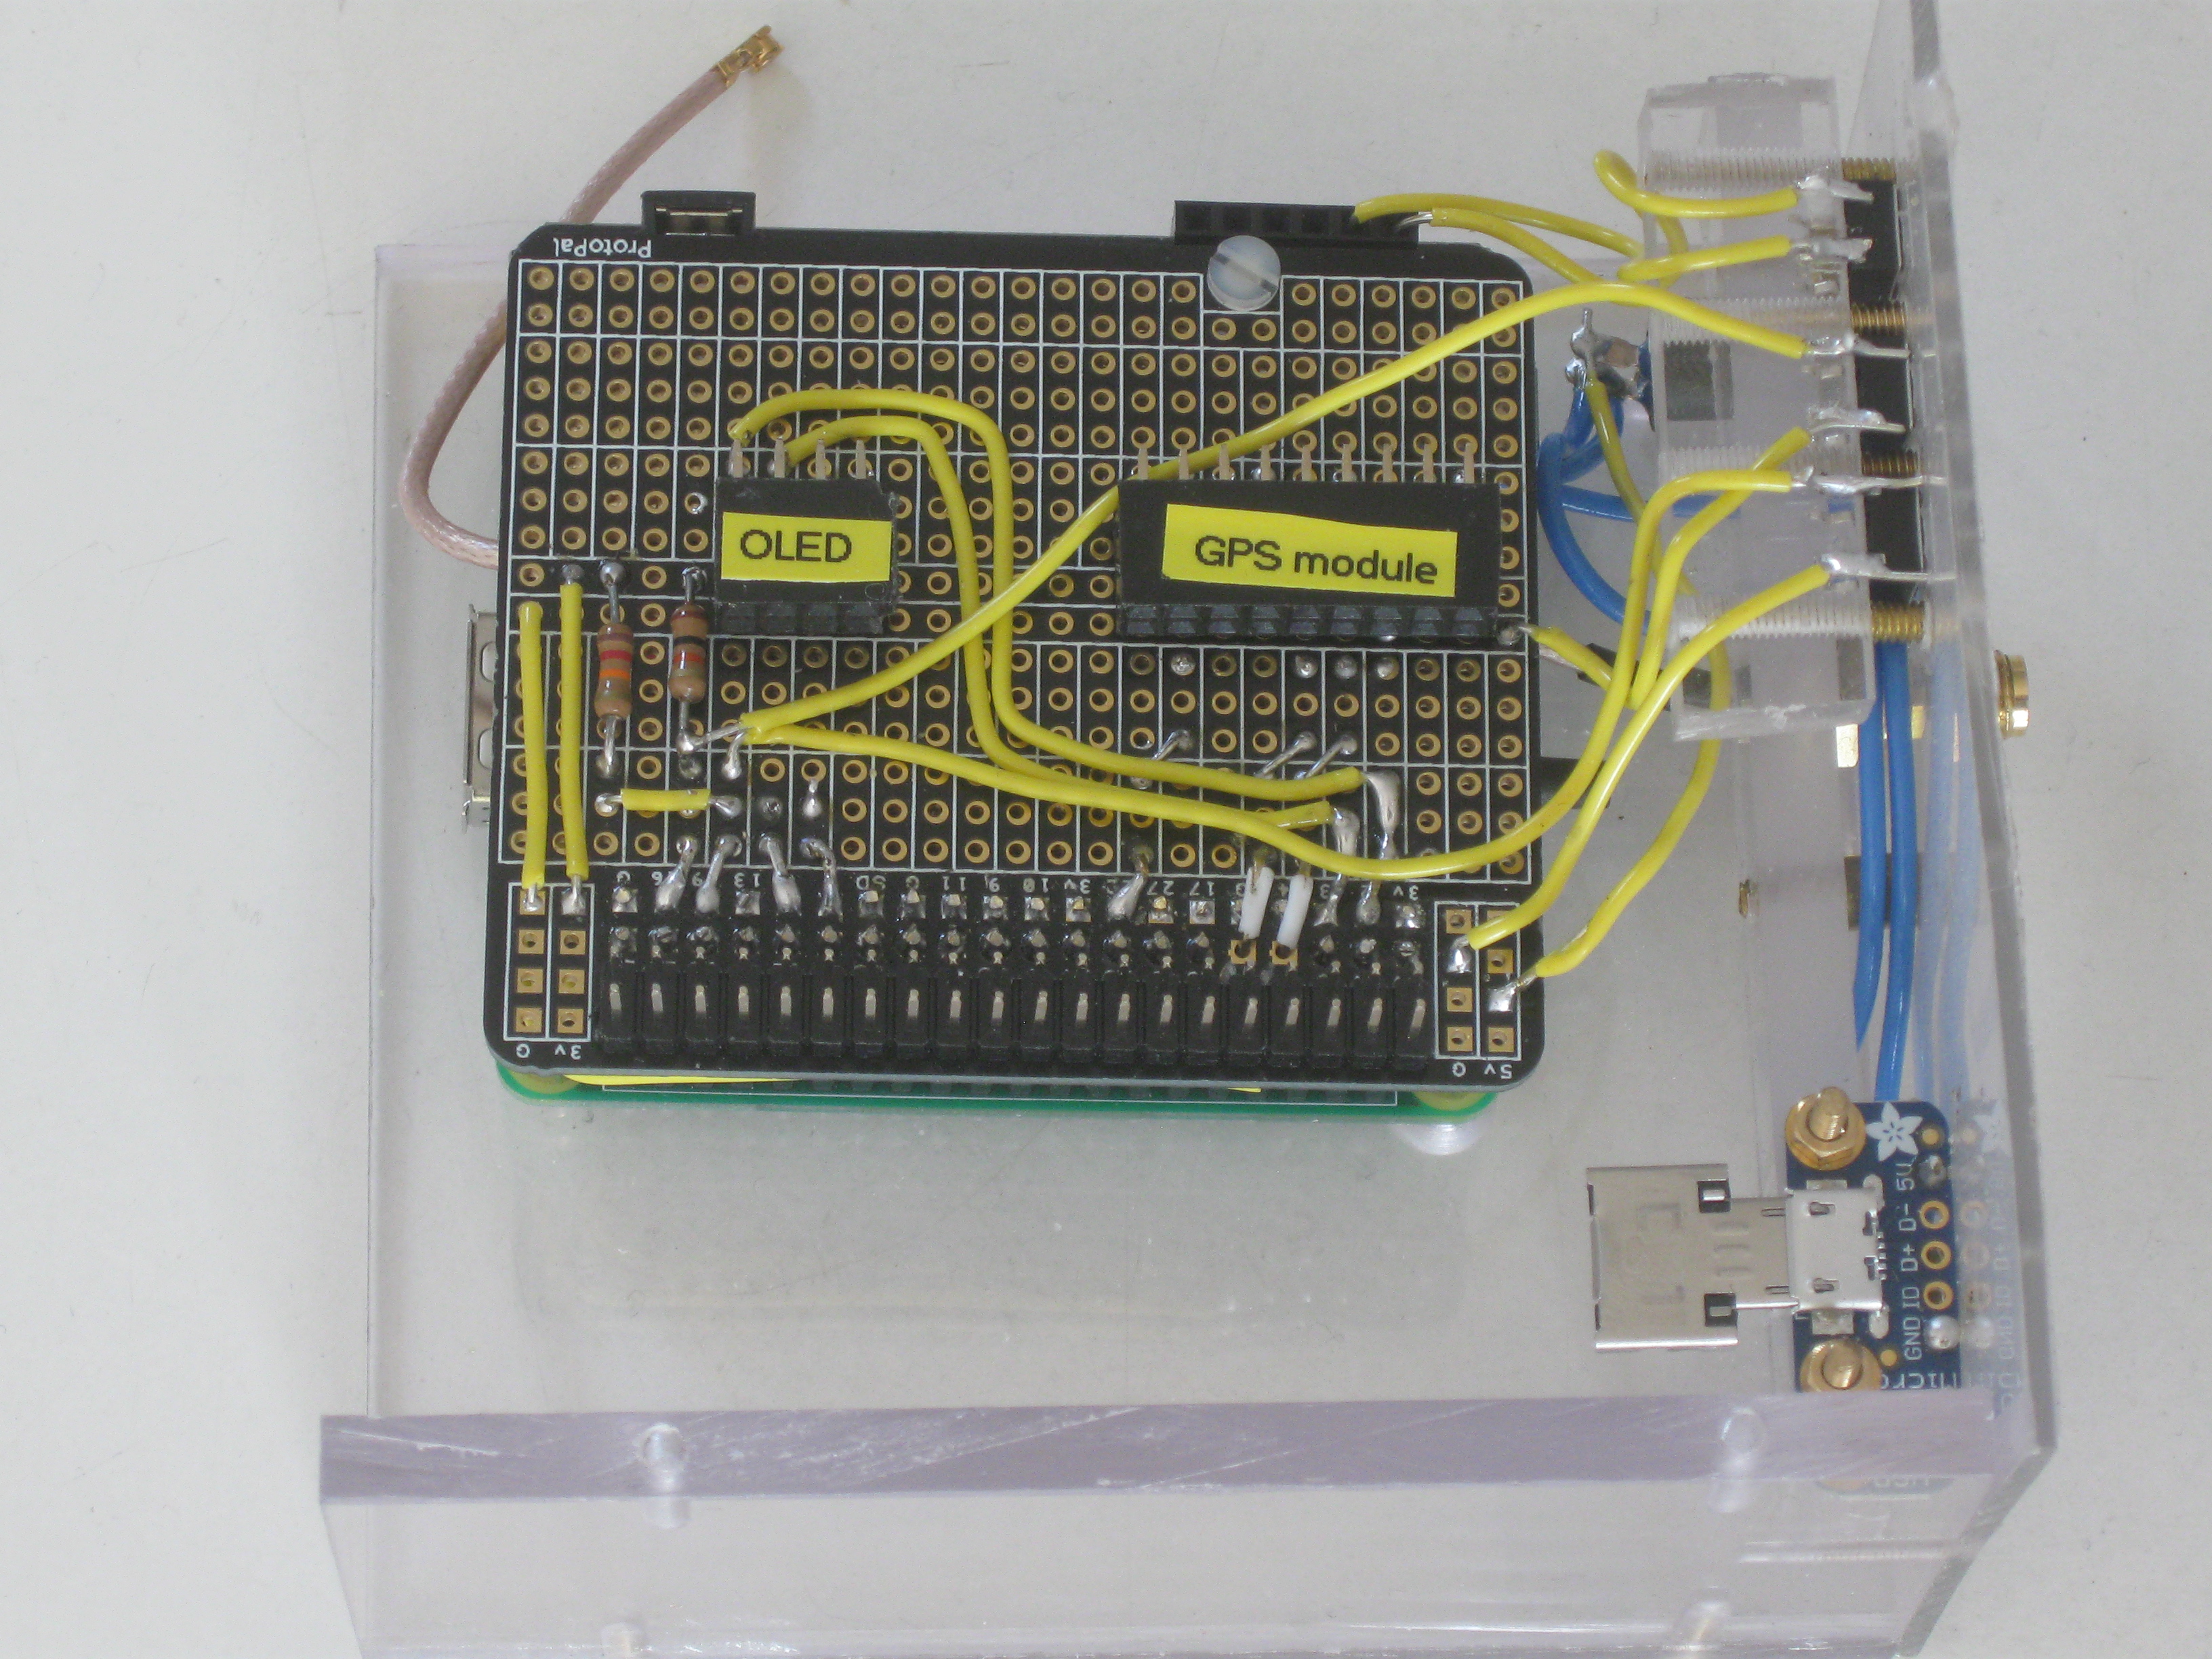
This is the breakout board, fitted on top of the Raspberry Pi and Witty Pi, with space for the OLED display and the GPS module as well as a header for the PaPiRus display. The case has four push-button switches: most of these are for controlling the power - one (either a red external button or fitted with a longer stem and thus easily accessible to the user) forces it on, one asks the application to shut down but leave power on and one asks the Witty Pi to turn on or off immediately. The fourth button tests to see whether there is a USB pen drive plugged in and downloads the log to it.
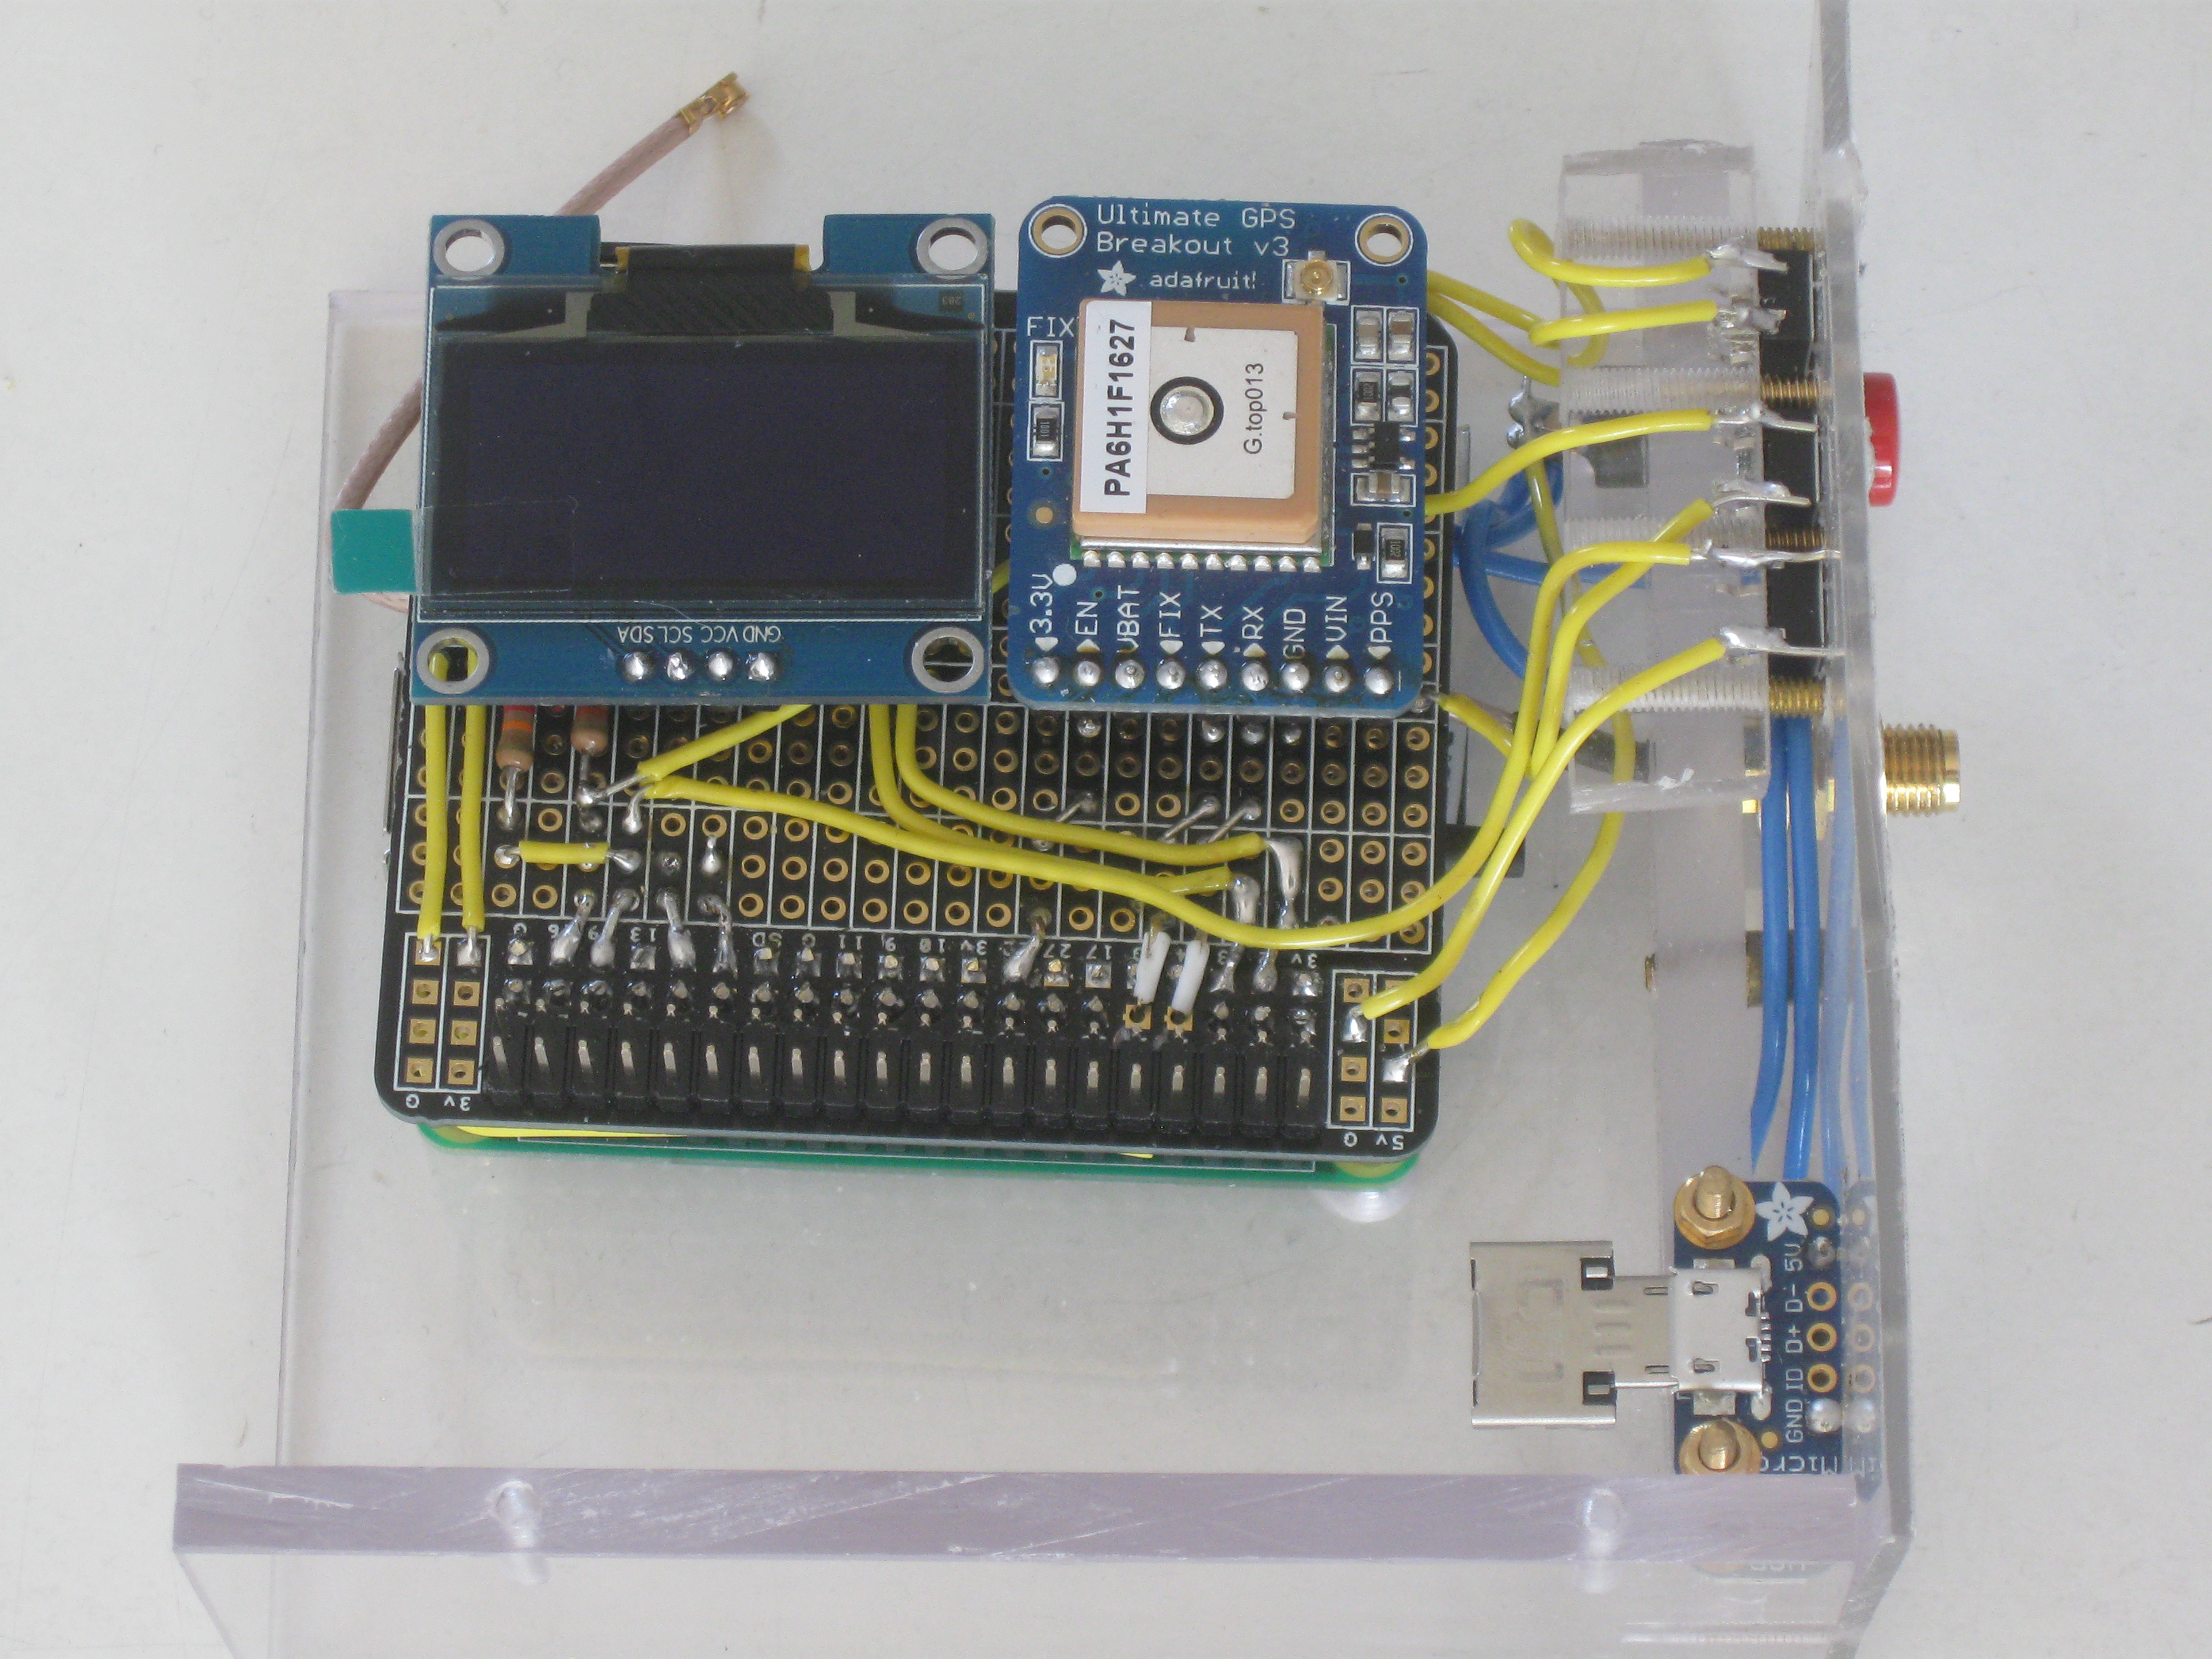
Both the OLED and GPS module are now plugged in.
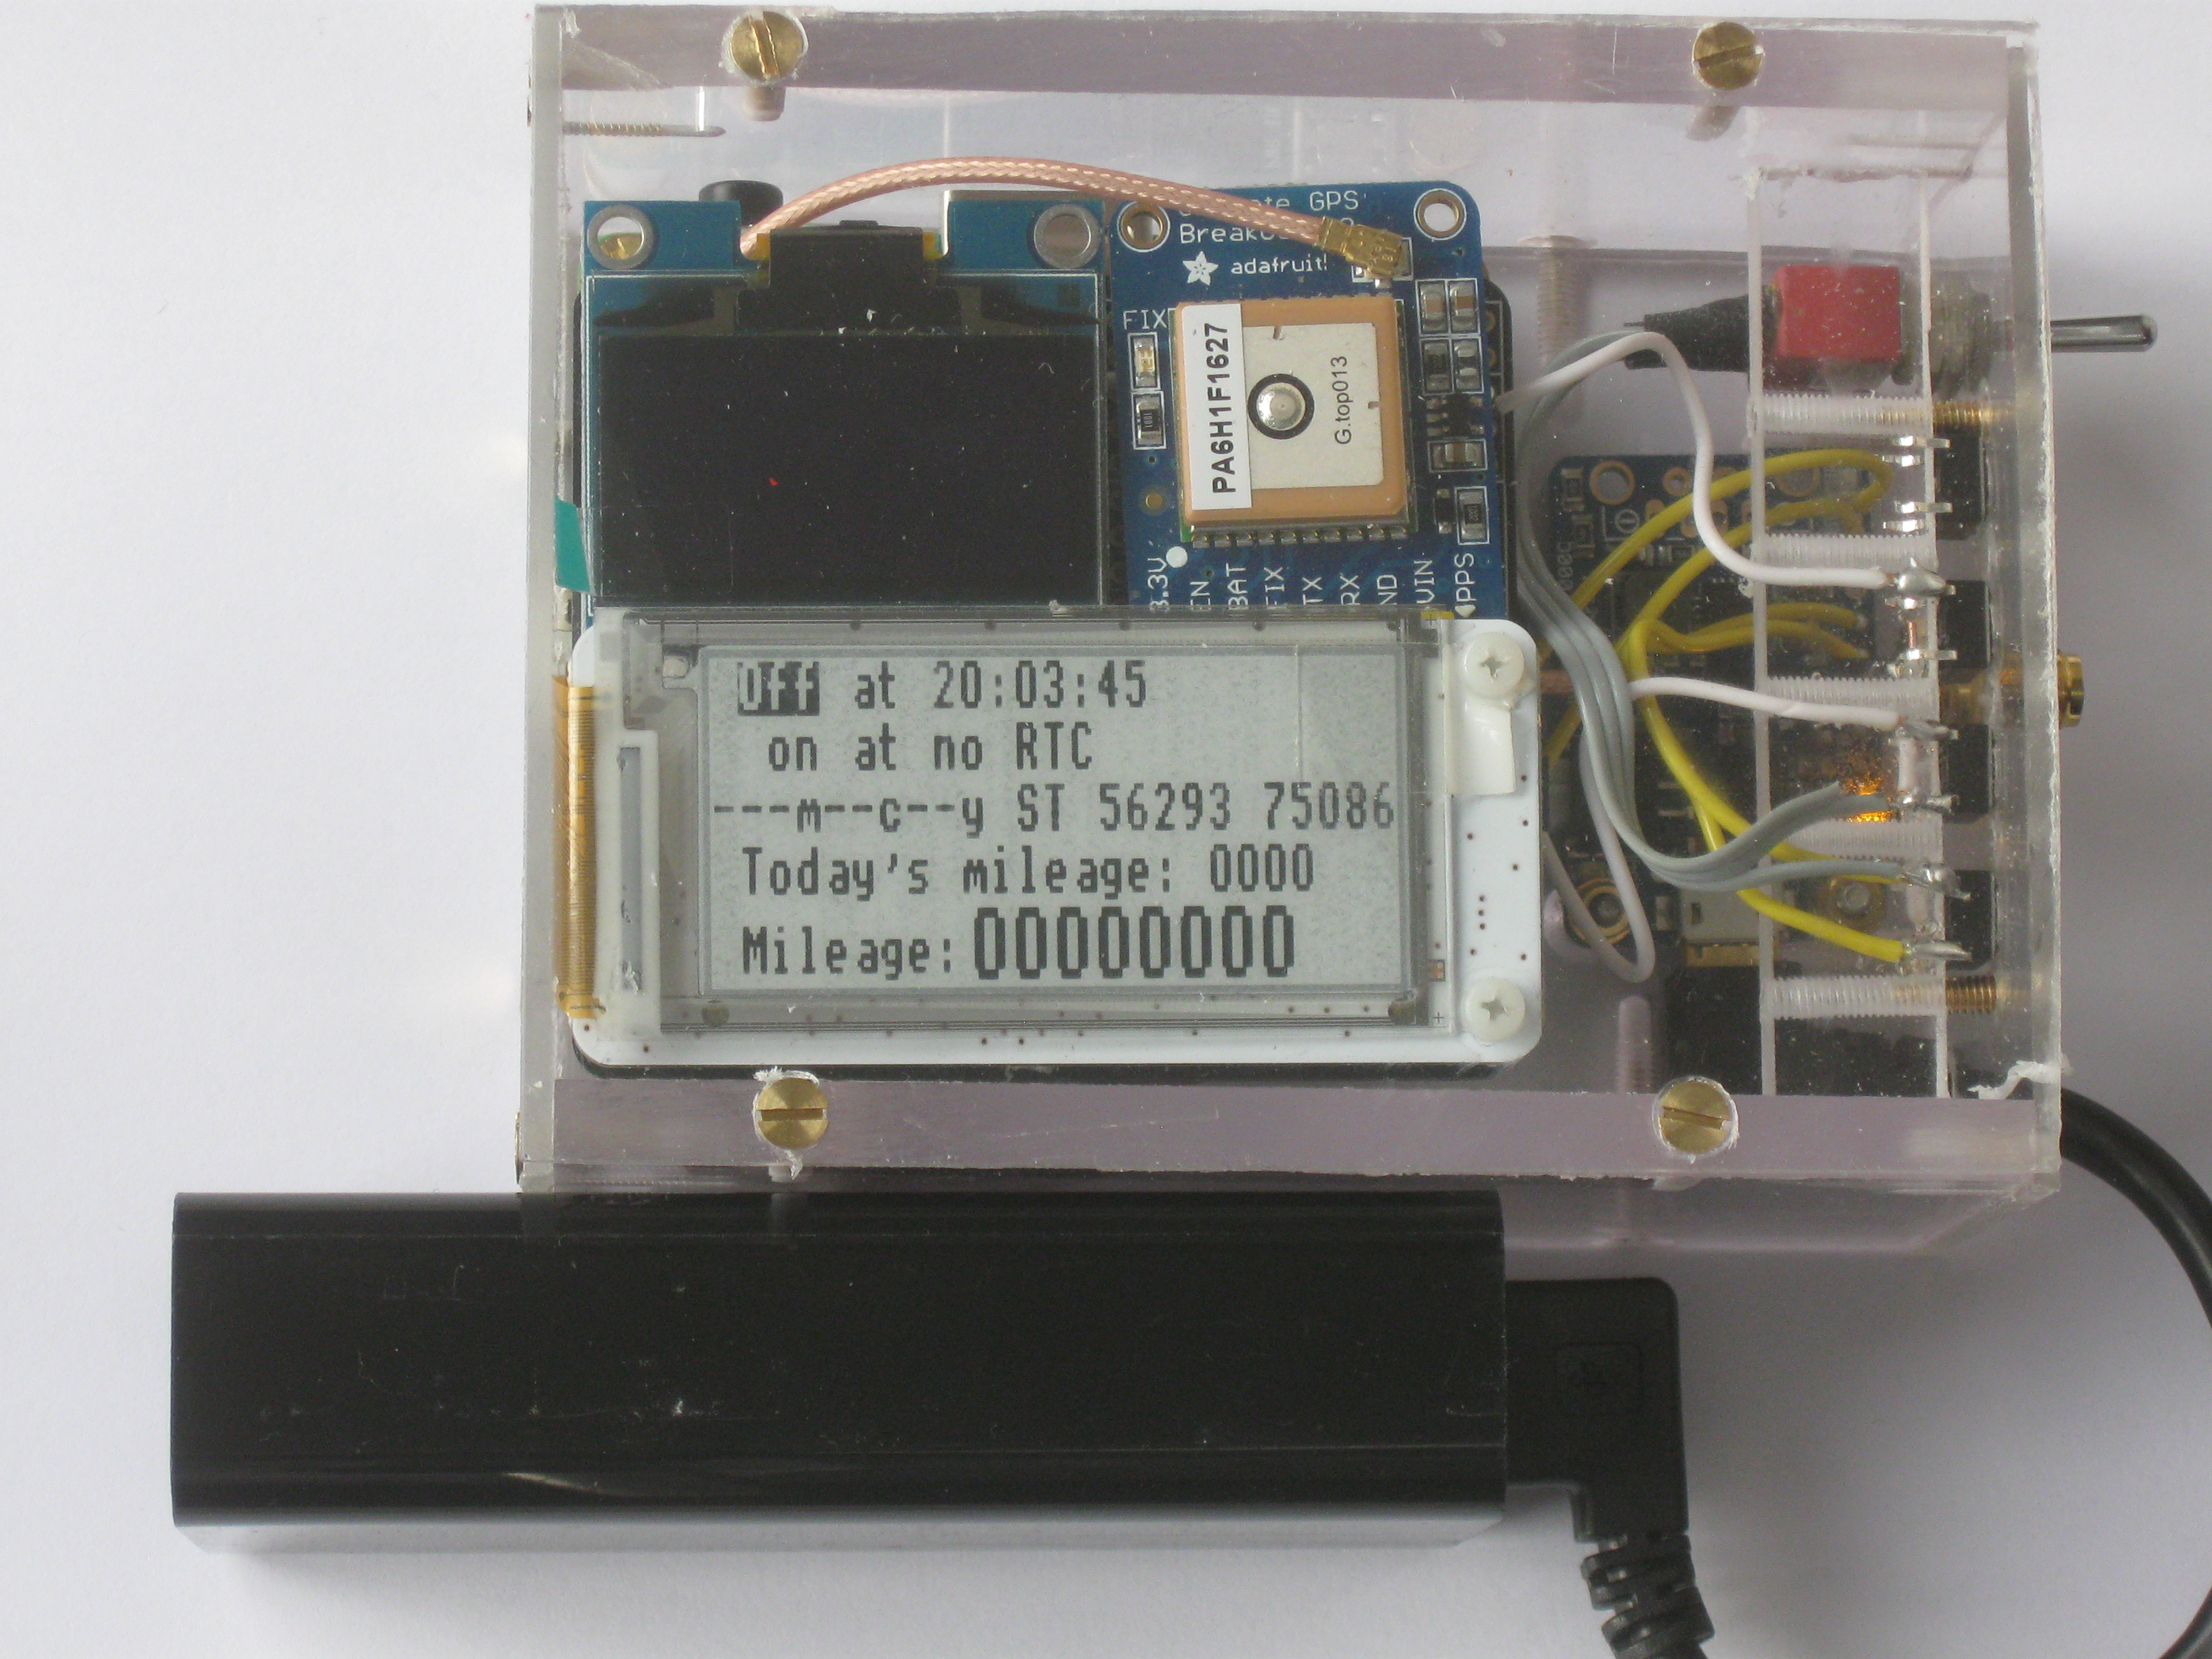
The latest version of the hardware is now containind in a sealed polycarbonate box, with magnetic feet, and with an enlarged OLED display. It is made up of a Raspberry Pi on which is mounted a Witty Pi (for controlling power on and off via a real time clock with an alarm facility) onto which is mounted a breakout board. An OLED display, a GPS module and a PaPiRus display all plug onto the breakout board.
The previous case only had room for a 5000mAh battery but this case has room for a 14000mAh battery, is built more strongly, has covers that fit over the HDMI and USB ports and has magnetic feet. The computer turns on and off to conserve battery life.
A further development has a smaller battery (2000mAh) fitted internally with a trailing lead for an external power source, battery or mains. Unlike the various power banks available which only have a single voltage shifter (to connect the 3.7V battery either to a 5V input to charge it or to a 5V output to supply power) this has a 'power booster' board that allows the internal battery to be charged if there is an external power source and supplies the computer from the external source (if it is there) only using the internal battery if no external source is connected. This means the external source can be connected and disconnected without affecting the operation of the device. It has a power switch so that only a minimal load is drawn with the computer off. A red LED lights if the internal battery becomes discharged below 3V. Fully discharging the internal battery is likely to damage it. While the internal battery is being charged a yellow LED lights, turning green when it is fully charged. A blue LED lights is power is being supplied to the computer. No Witty Pi is included so the computer stays on while the power switch is on.

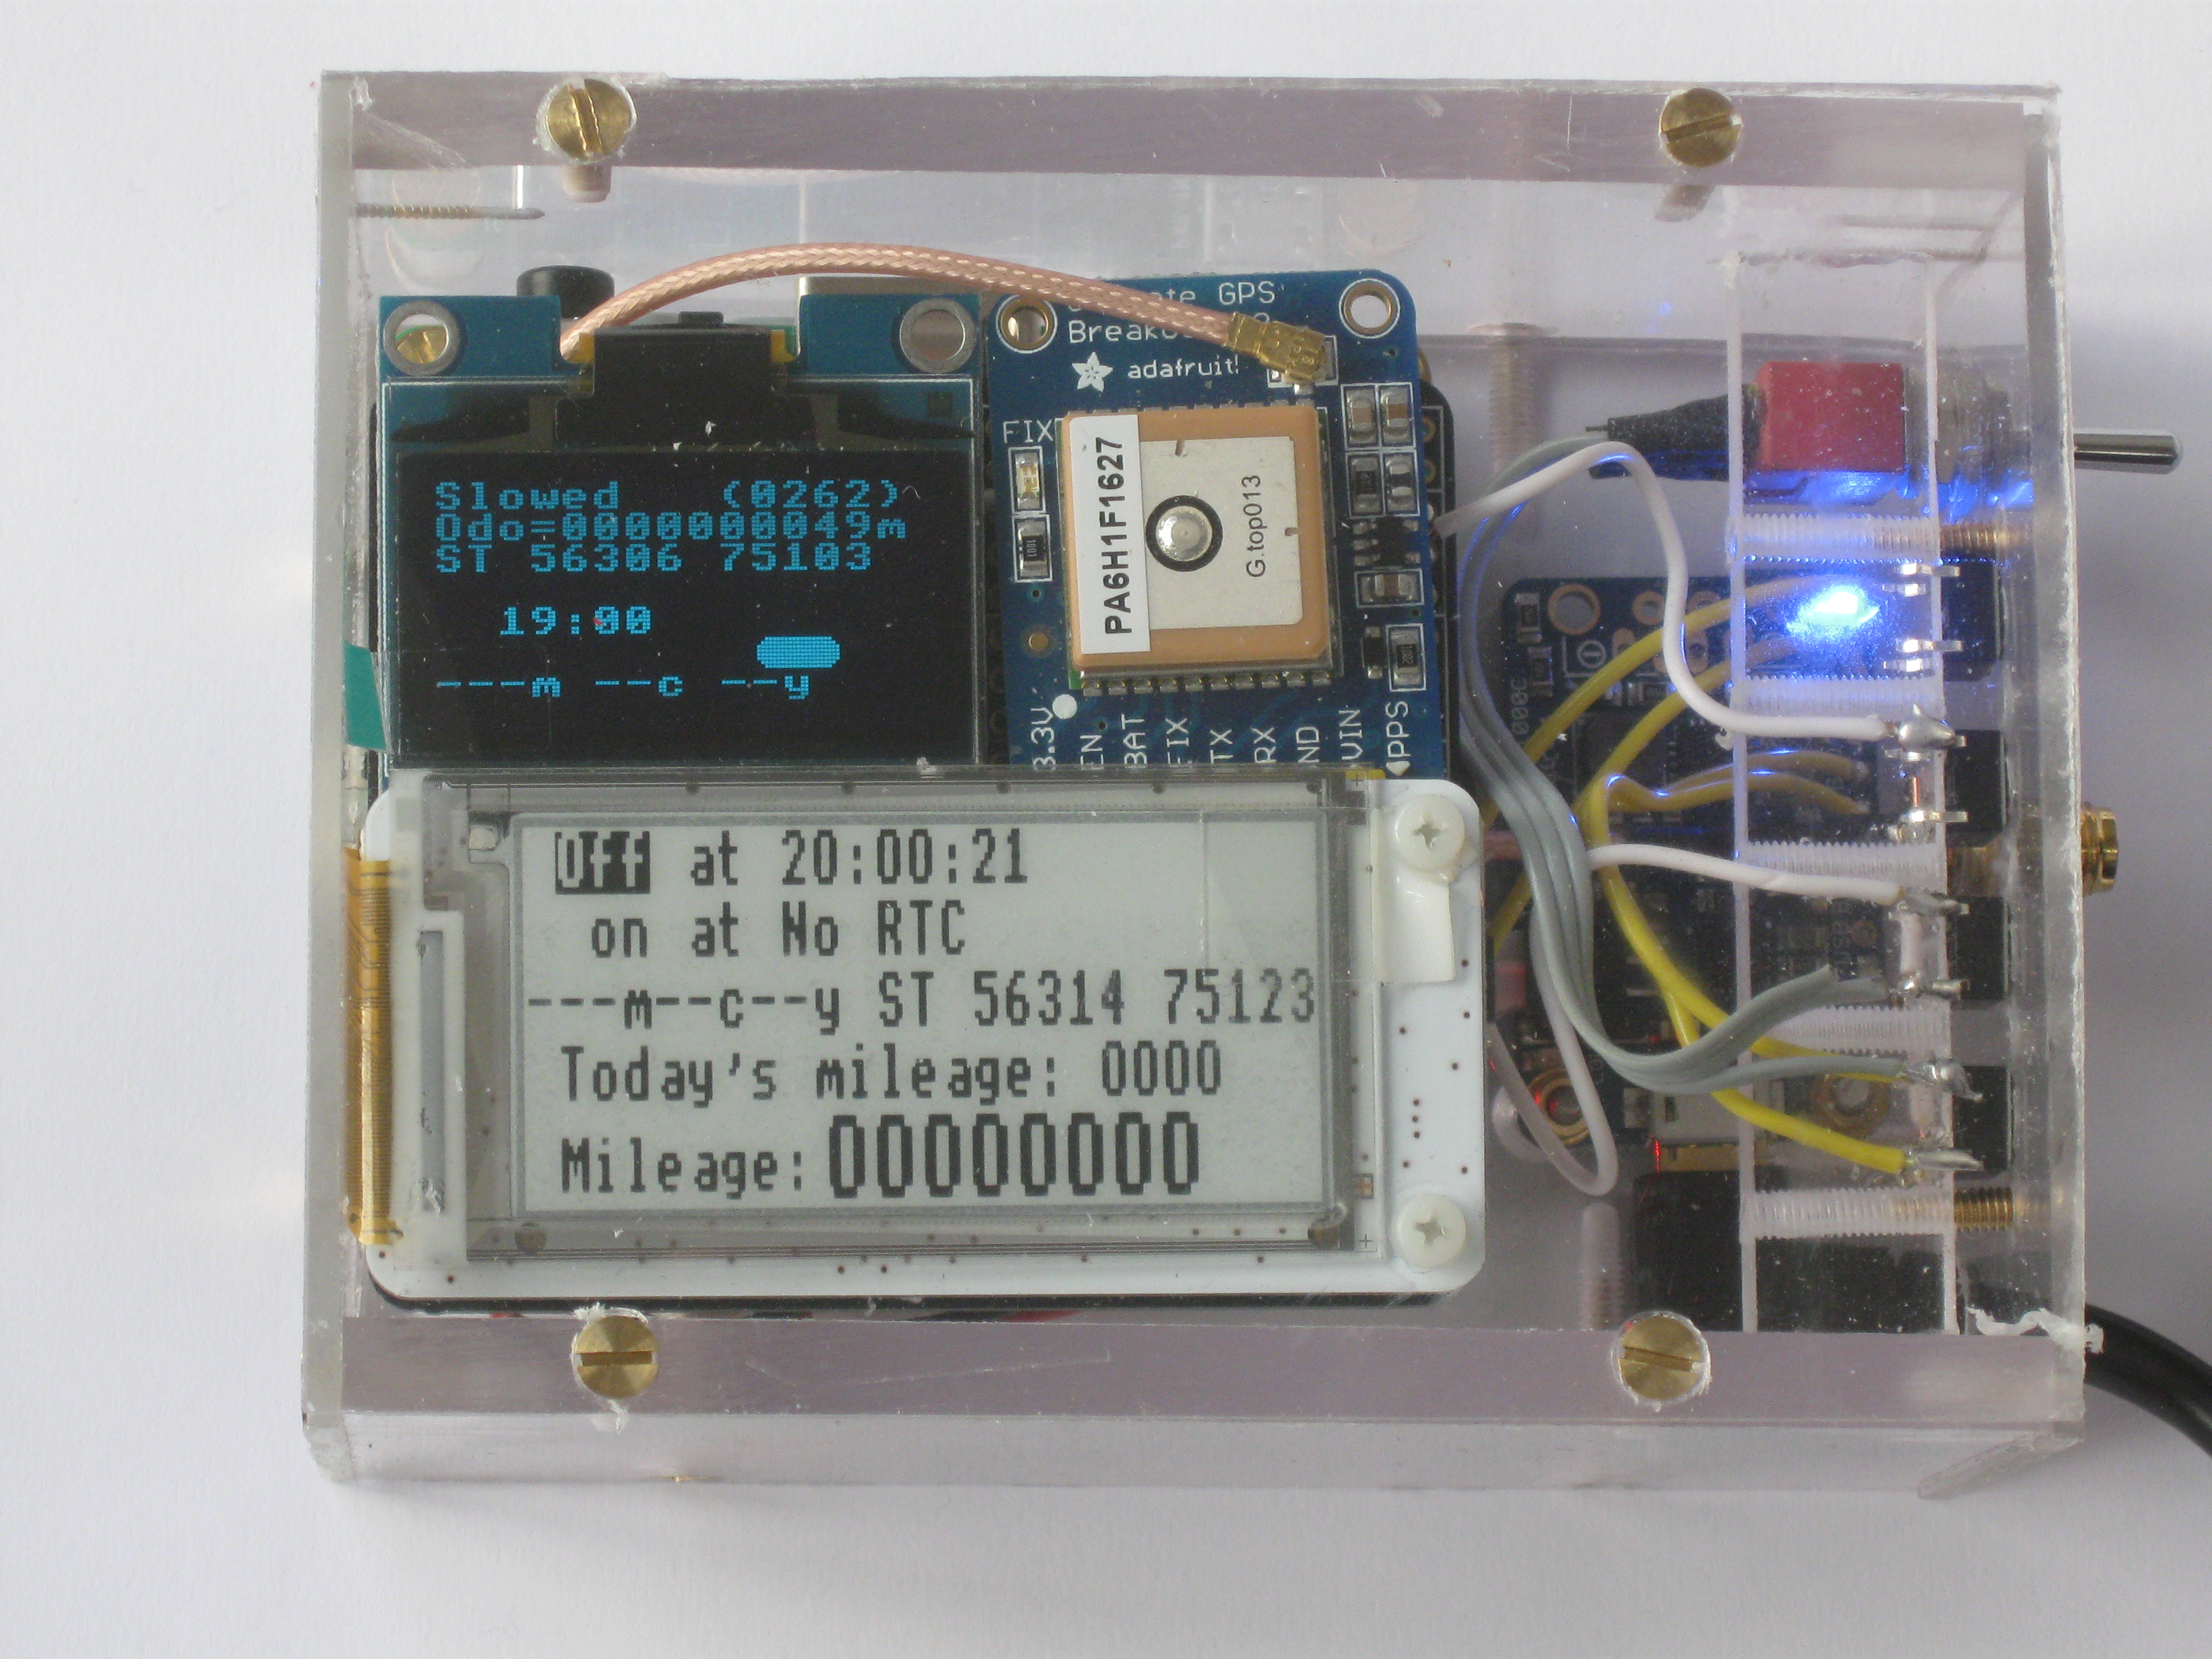
The position is drifting slightly so that a speed of 1mph is recorded - below 2.9mph some detail is included, less detail if the speed is up to 3.9mph and just the speed figure (in mph) if the speed is 4mph or greater.
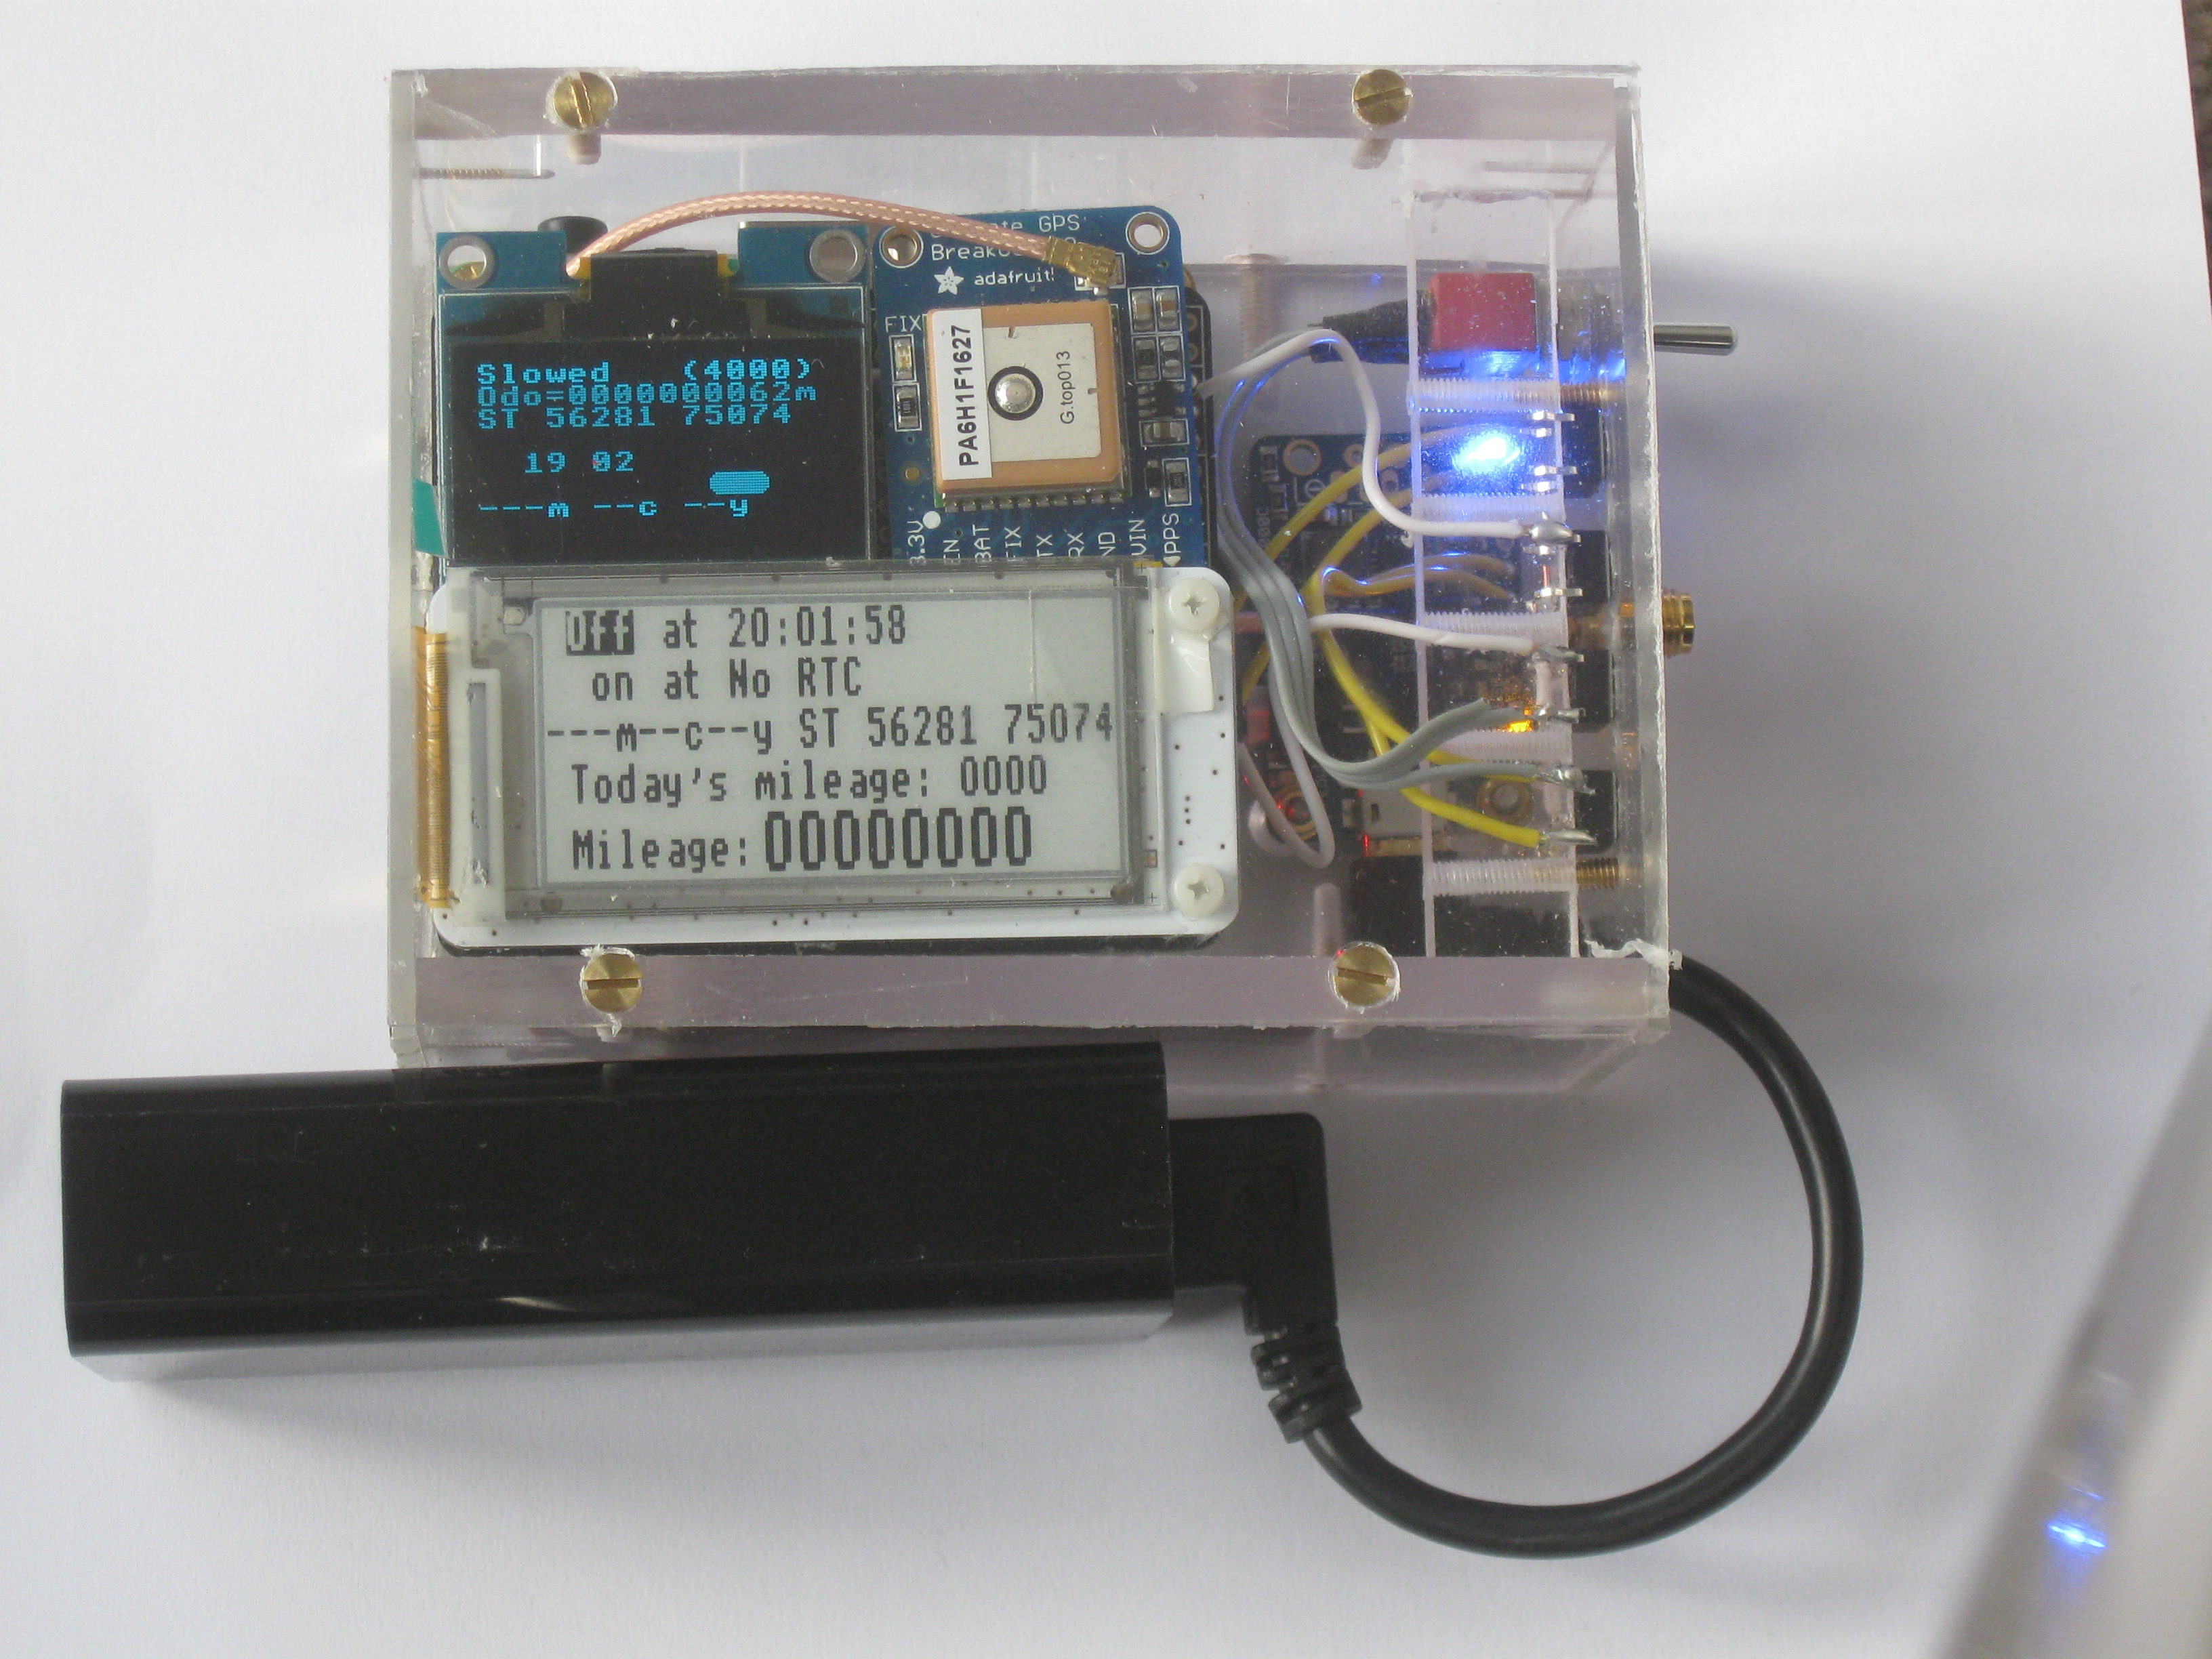
With an external power source connected the yellow LED lights to show that the internal battery is being charged (at up to 1A) and the load is being supplied from the external battery.
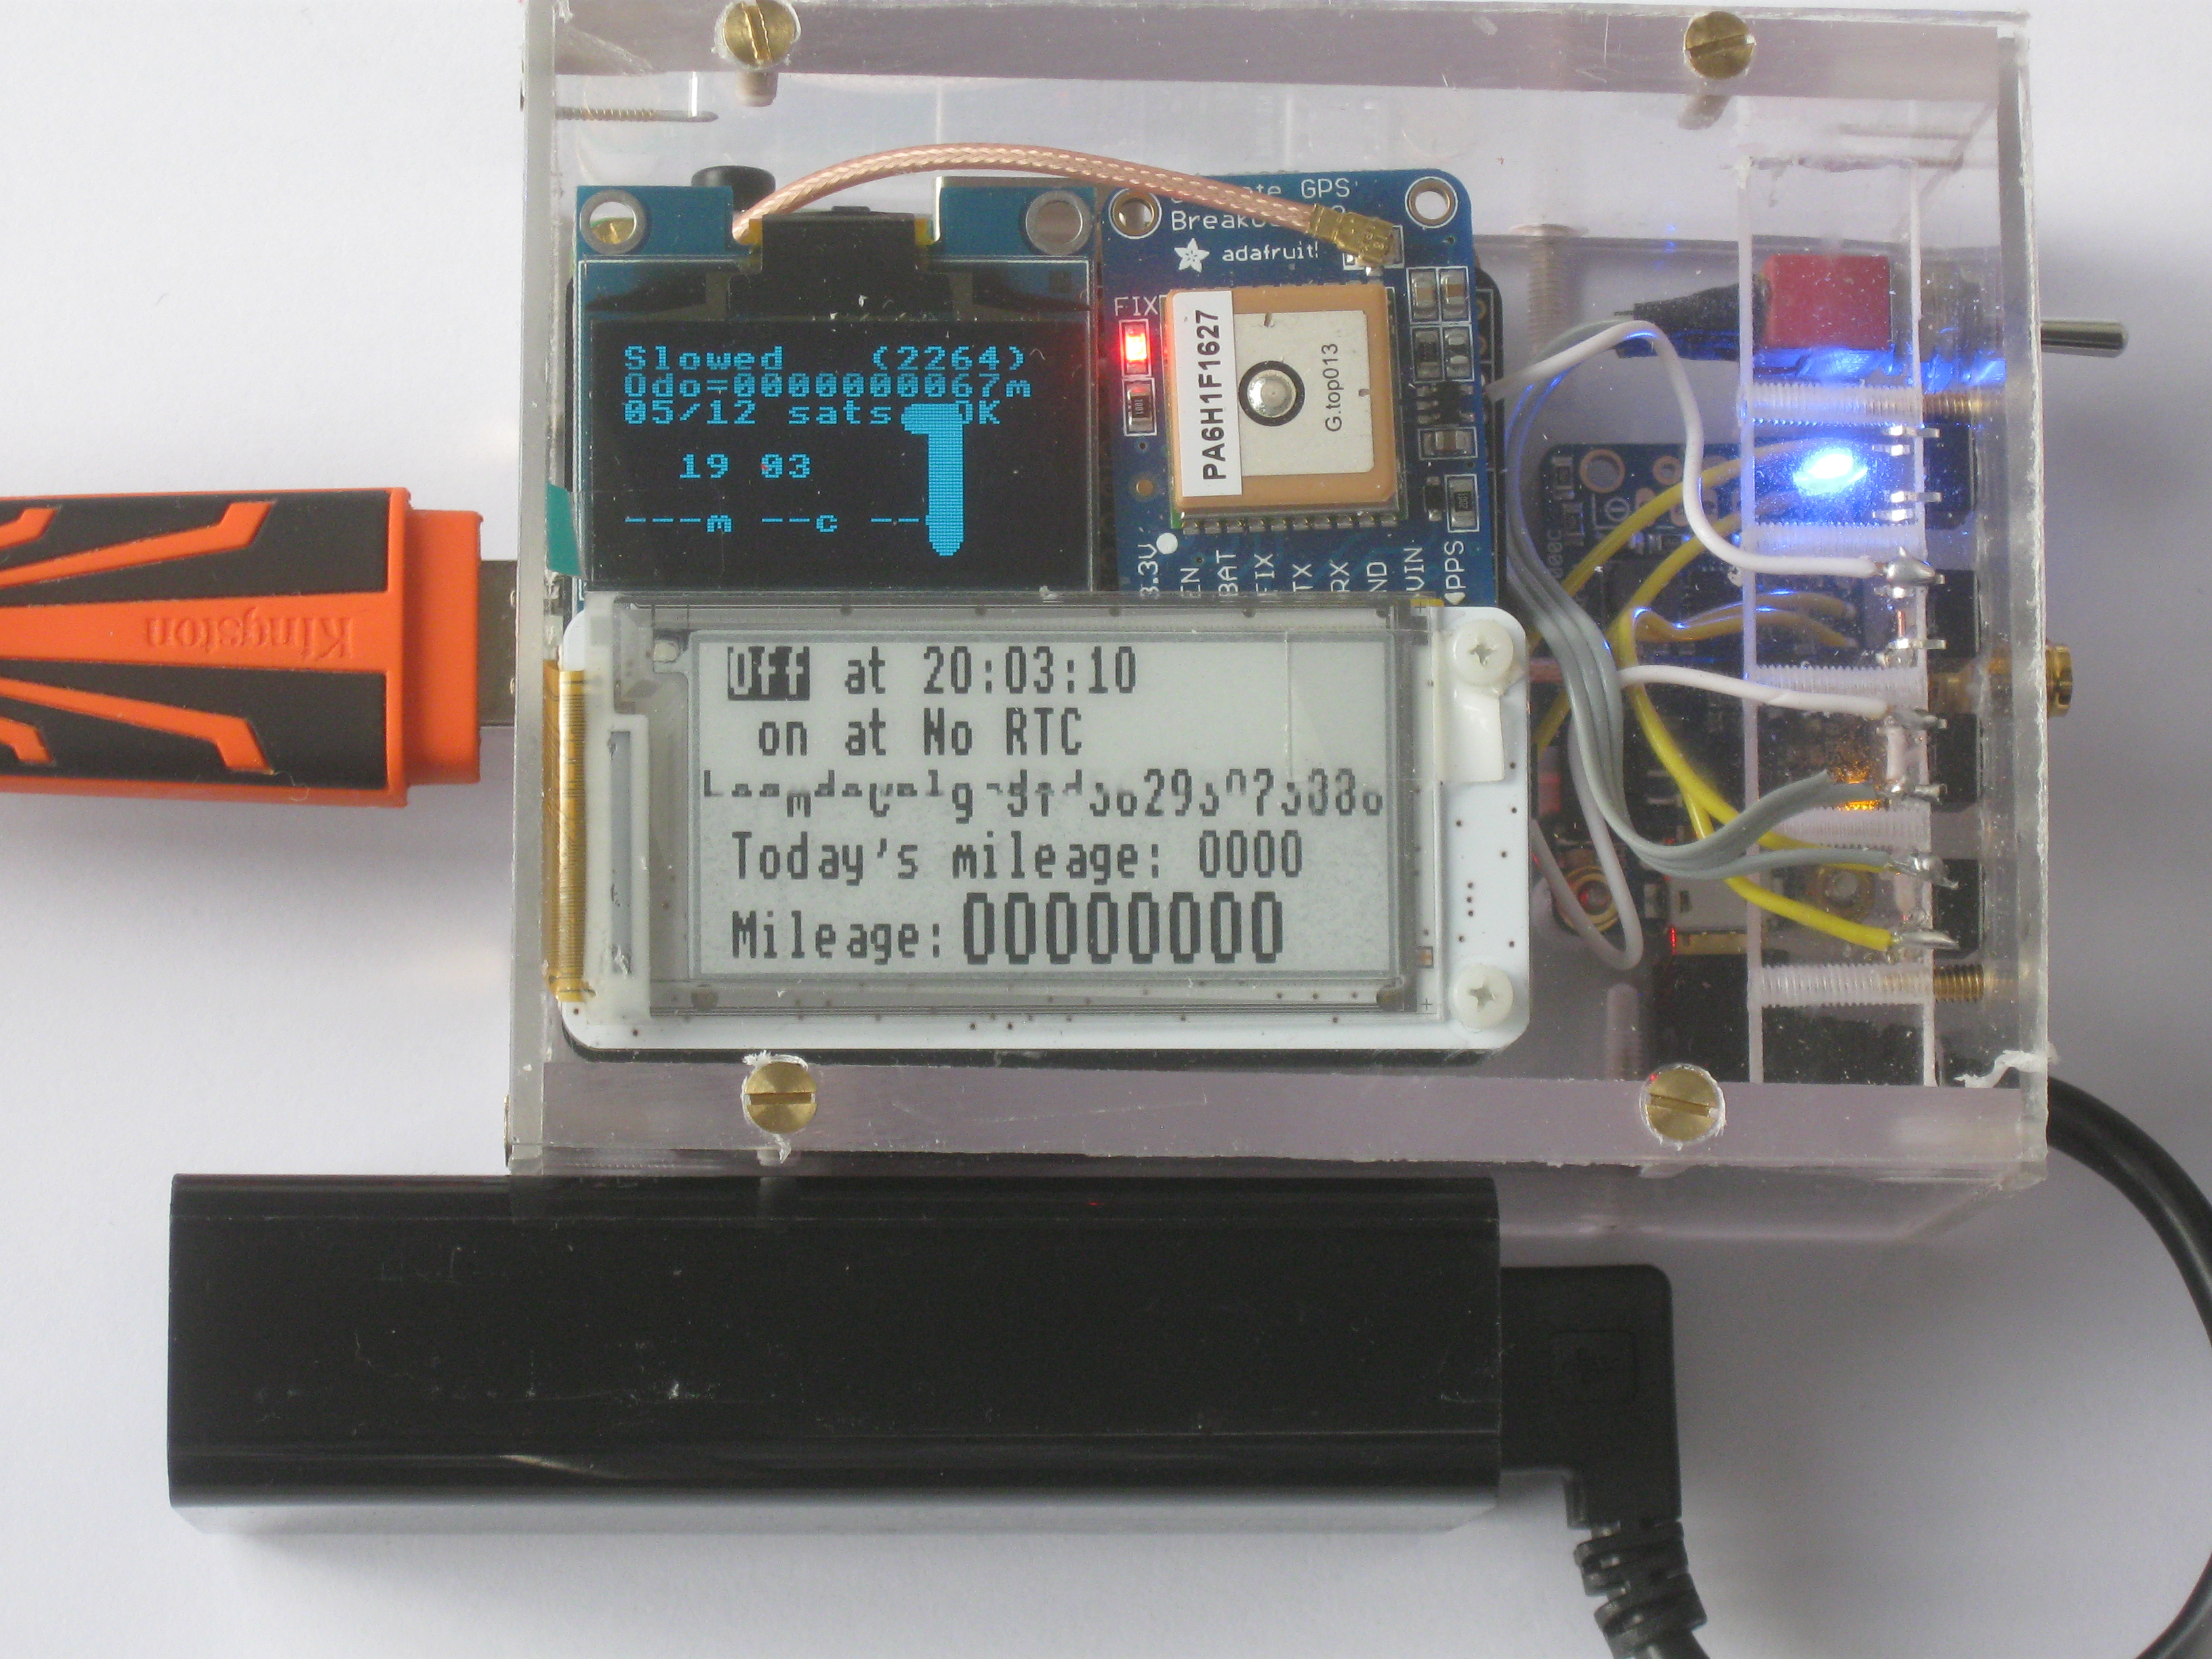
The button has been pressed to download the log and the PaPiRus display is being updated to say 'Log downloaded at 20:03:55'. Although there is no real time clock (prevoiusly provided on the Witty Pi board, not fitted to this version) the time and date are imported from the GPS signal (there is no internet connection to access a time server).
Power has been turned off (using the two position SPDT switch) but the external battery is still charging the internal battery.
The logging now looks like the following:
Anquet Maps,AEF,V2
RouteStart,&5643E8B9 Odo: 3812,manual 17:45:26 29-May
Waypoint,135m28c 5y,383746.1,276024,1,"Kidderminster Speed: 0 mph","Odo: 8939","Time: 17:45:26 29-May"
Waypoint,135m24c18y,383735.287,275972,1,"Kidderminster Speed: 26 mph","Odo: 8992","Time: 17:50:18 29-May"
Waypoint,135m40c15y,383574.1,275507,1," Speed: 26 mph","Odo: 9485","Time: 17:50:18 29-May"
...
Waypoint,149m69c12y,371604.9,292501,1,"Bridgnorth Speed: 9 mph","Odo: 34507","Time: 19:22:20 29-May"
Waypoint,149m72c 6y,371585.15,292553,1,"Bridgnorth Speed: 10 mph","Odo: 34562","Time: 19:22:35 29-May"
Waypoint,149m76c17y,371562.12,292605,1," Speed: 10 mph","Odo: 34619","Time: 19:22:48 29-May"
Waypoint,149m79c11y,371544.16,292656,1," Speed: 9 mph","Odo: 34673","Time: 19:23:03 29-May"
Waypoint,150m 1c15y,371521.8,292709,1," Speed: 9 mph","Odo: 34731","Time: 19:23:11 29-May"
Waypoint,150m 5c17y,371509.17,292761,1," Speed: 9 mph","Odo: 34784","Time: 19:23:29 29-May"
Waypoint,150m 6c21y,371500.8,292813,1," Speed: 10 mph","Odo: 34837","Time: 19:23:36 29-May"
Waypoint,Quit,371500,292813,1,"Quit","Odo: 34837","Time: 19:25:09 29-May"
RouteEnd
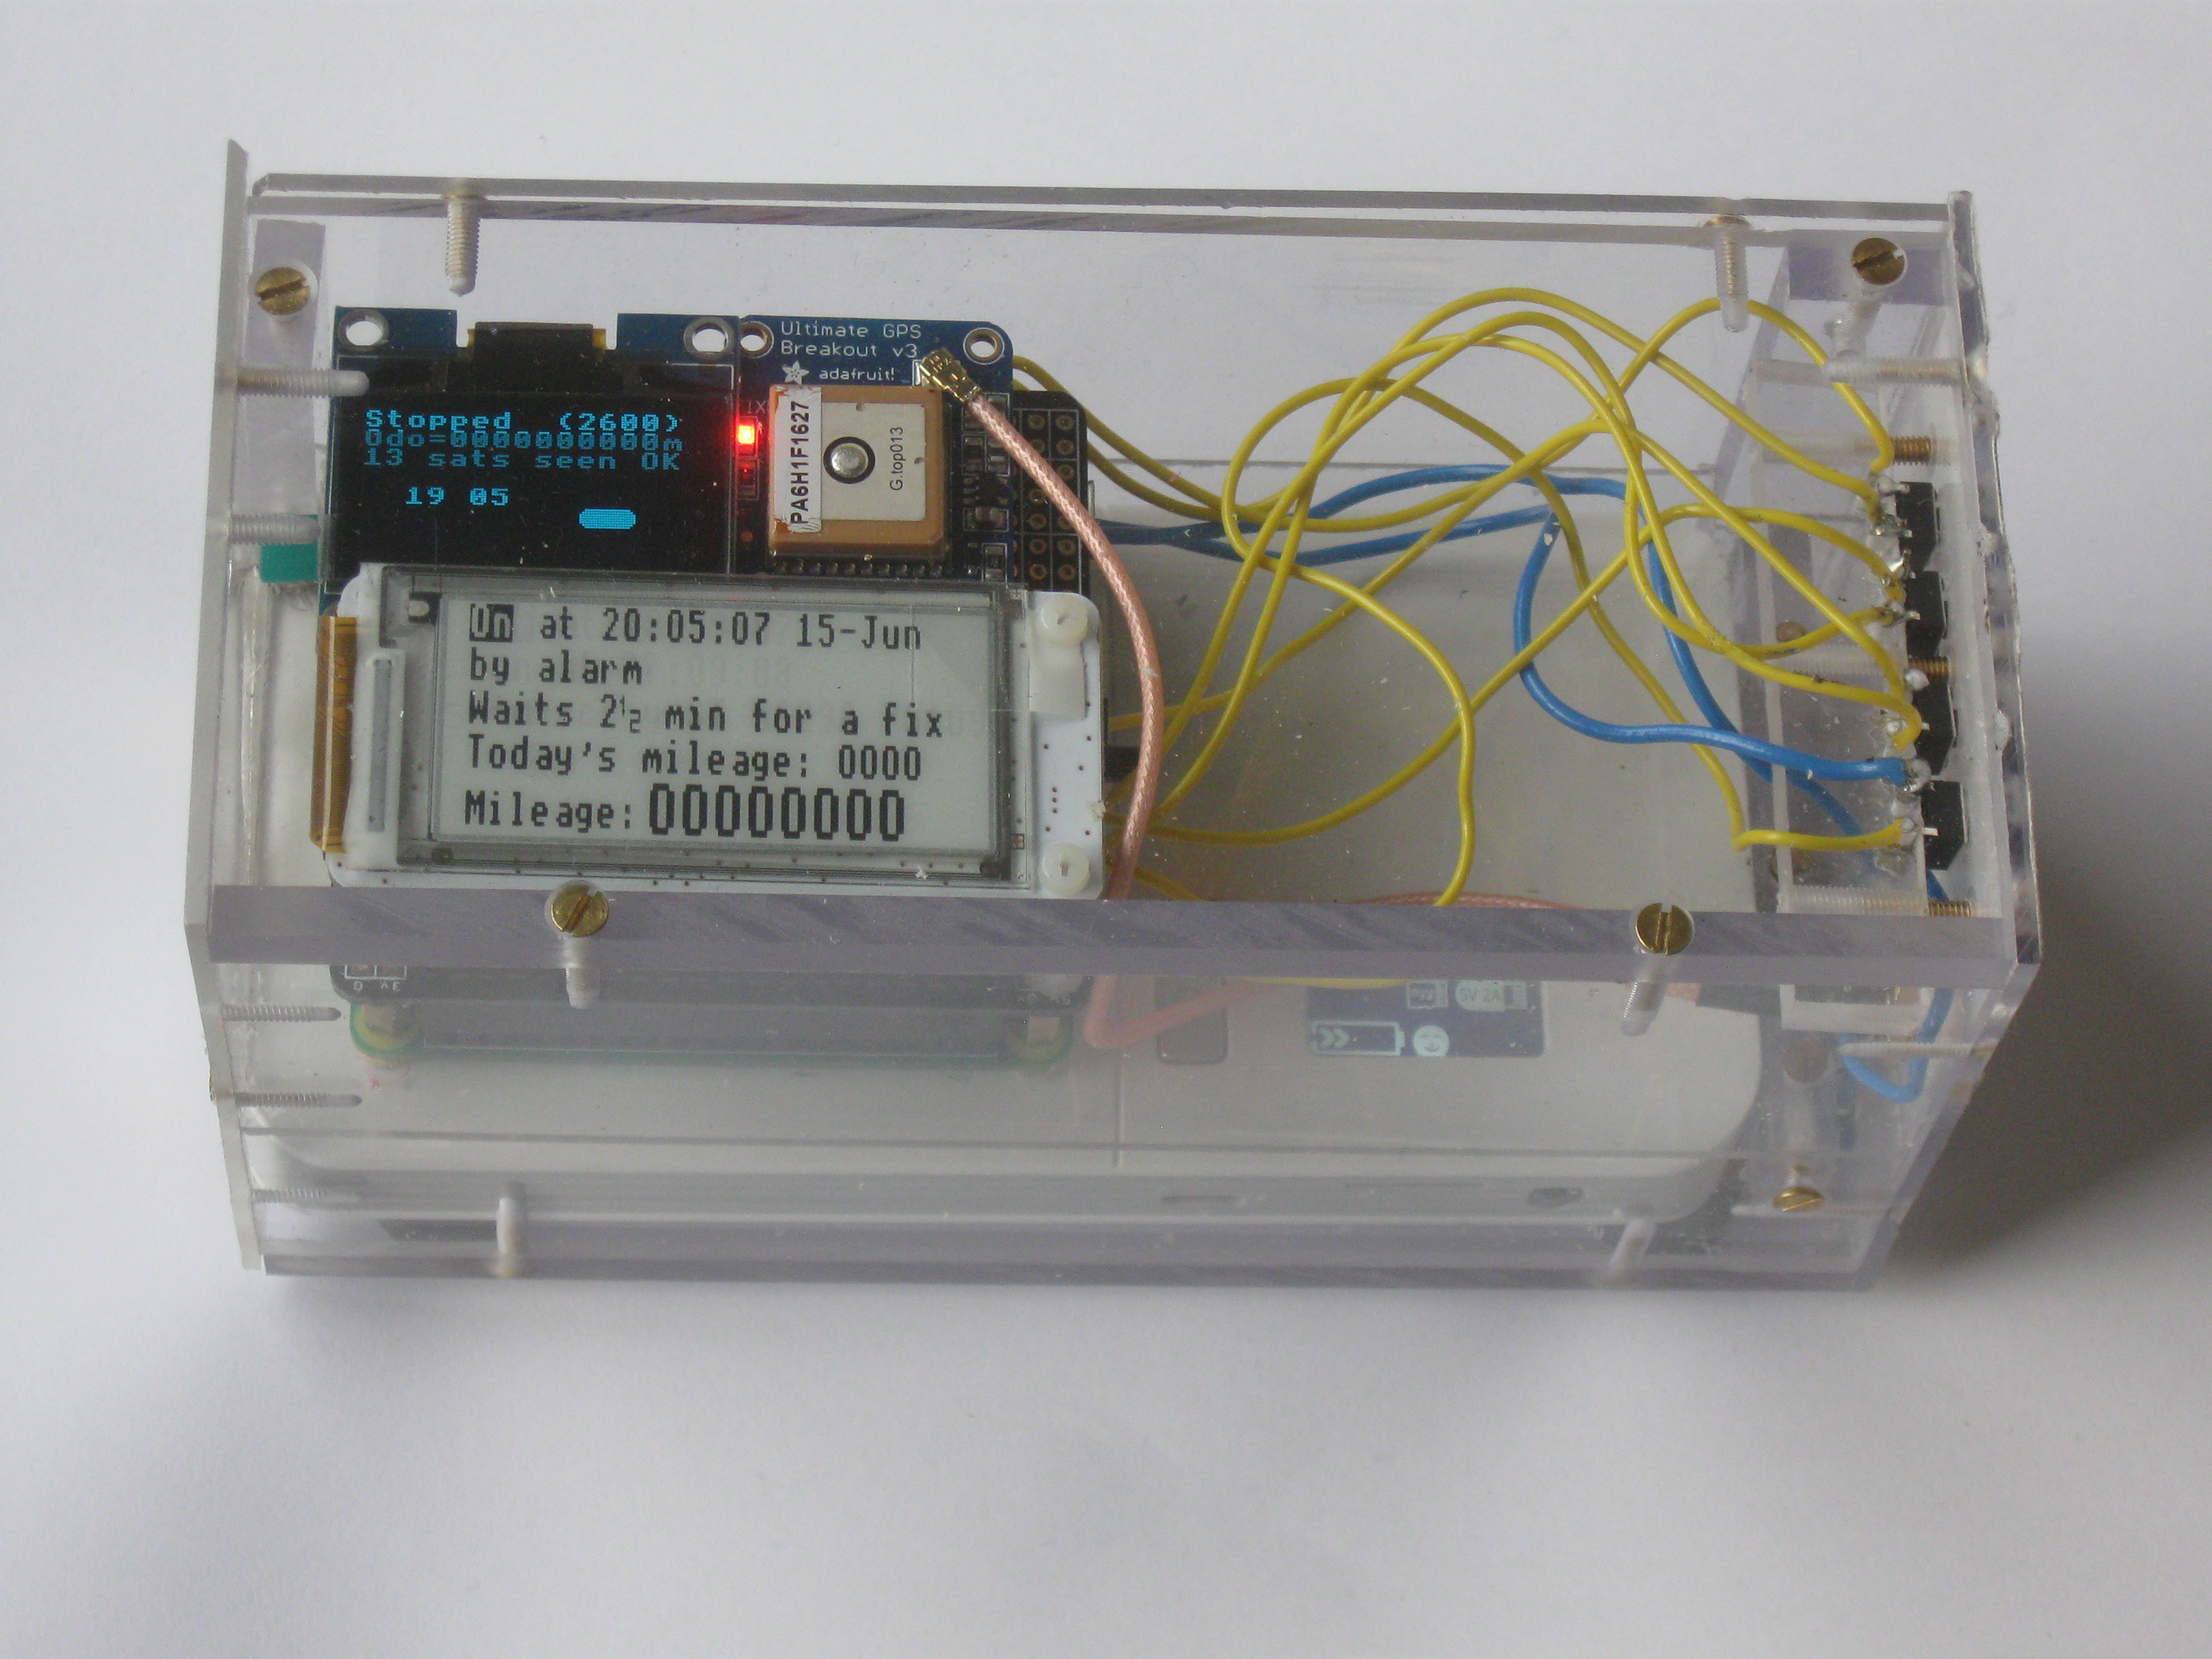
Using the model illustrated just above, I have captured the images shown on a short drive to the shops. It stores the images, along with the location where the image was captured and the result is shown with a map of the area showing the position by means of a red dot.

This model has power on throughout and consumes about 200mA (from the plug-in battery). About every 15 seconds, the electronic ink display is updated and each such update has been captured, along with the contents of the OLED display at the time. The OLED display itself is actually updated every 2 seconds.
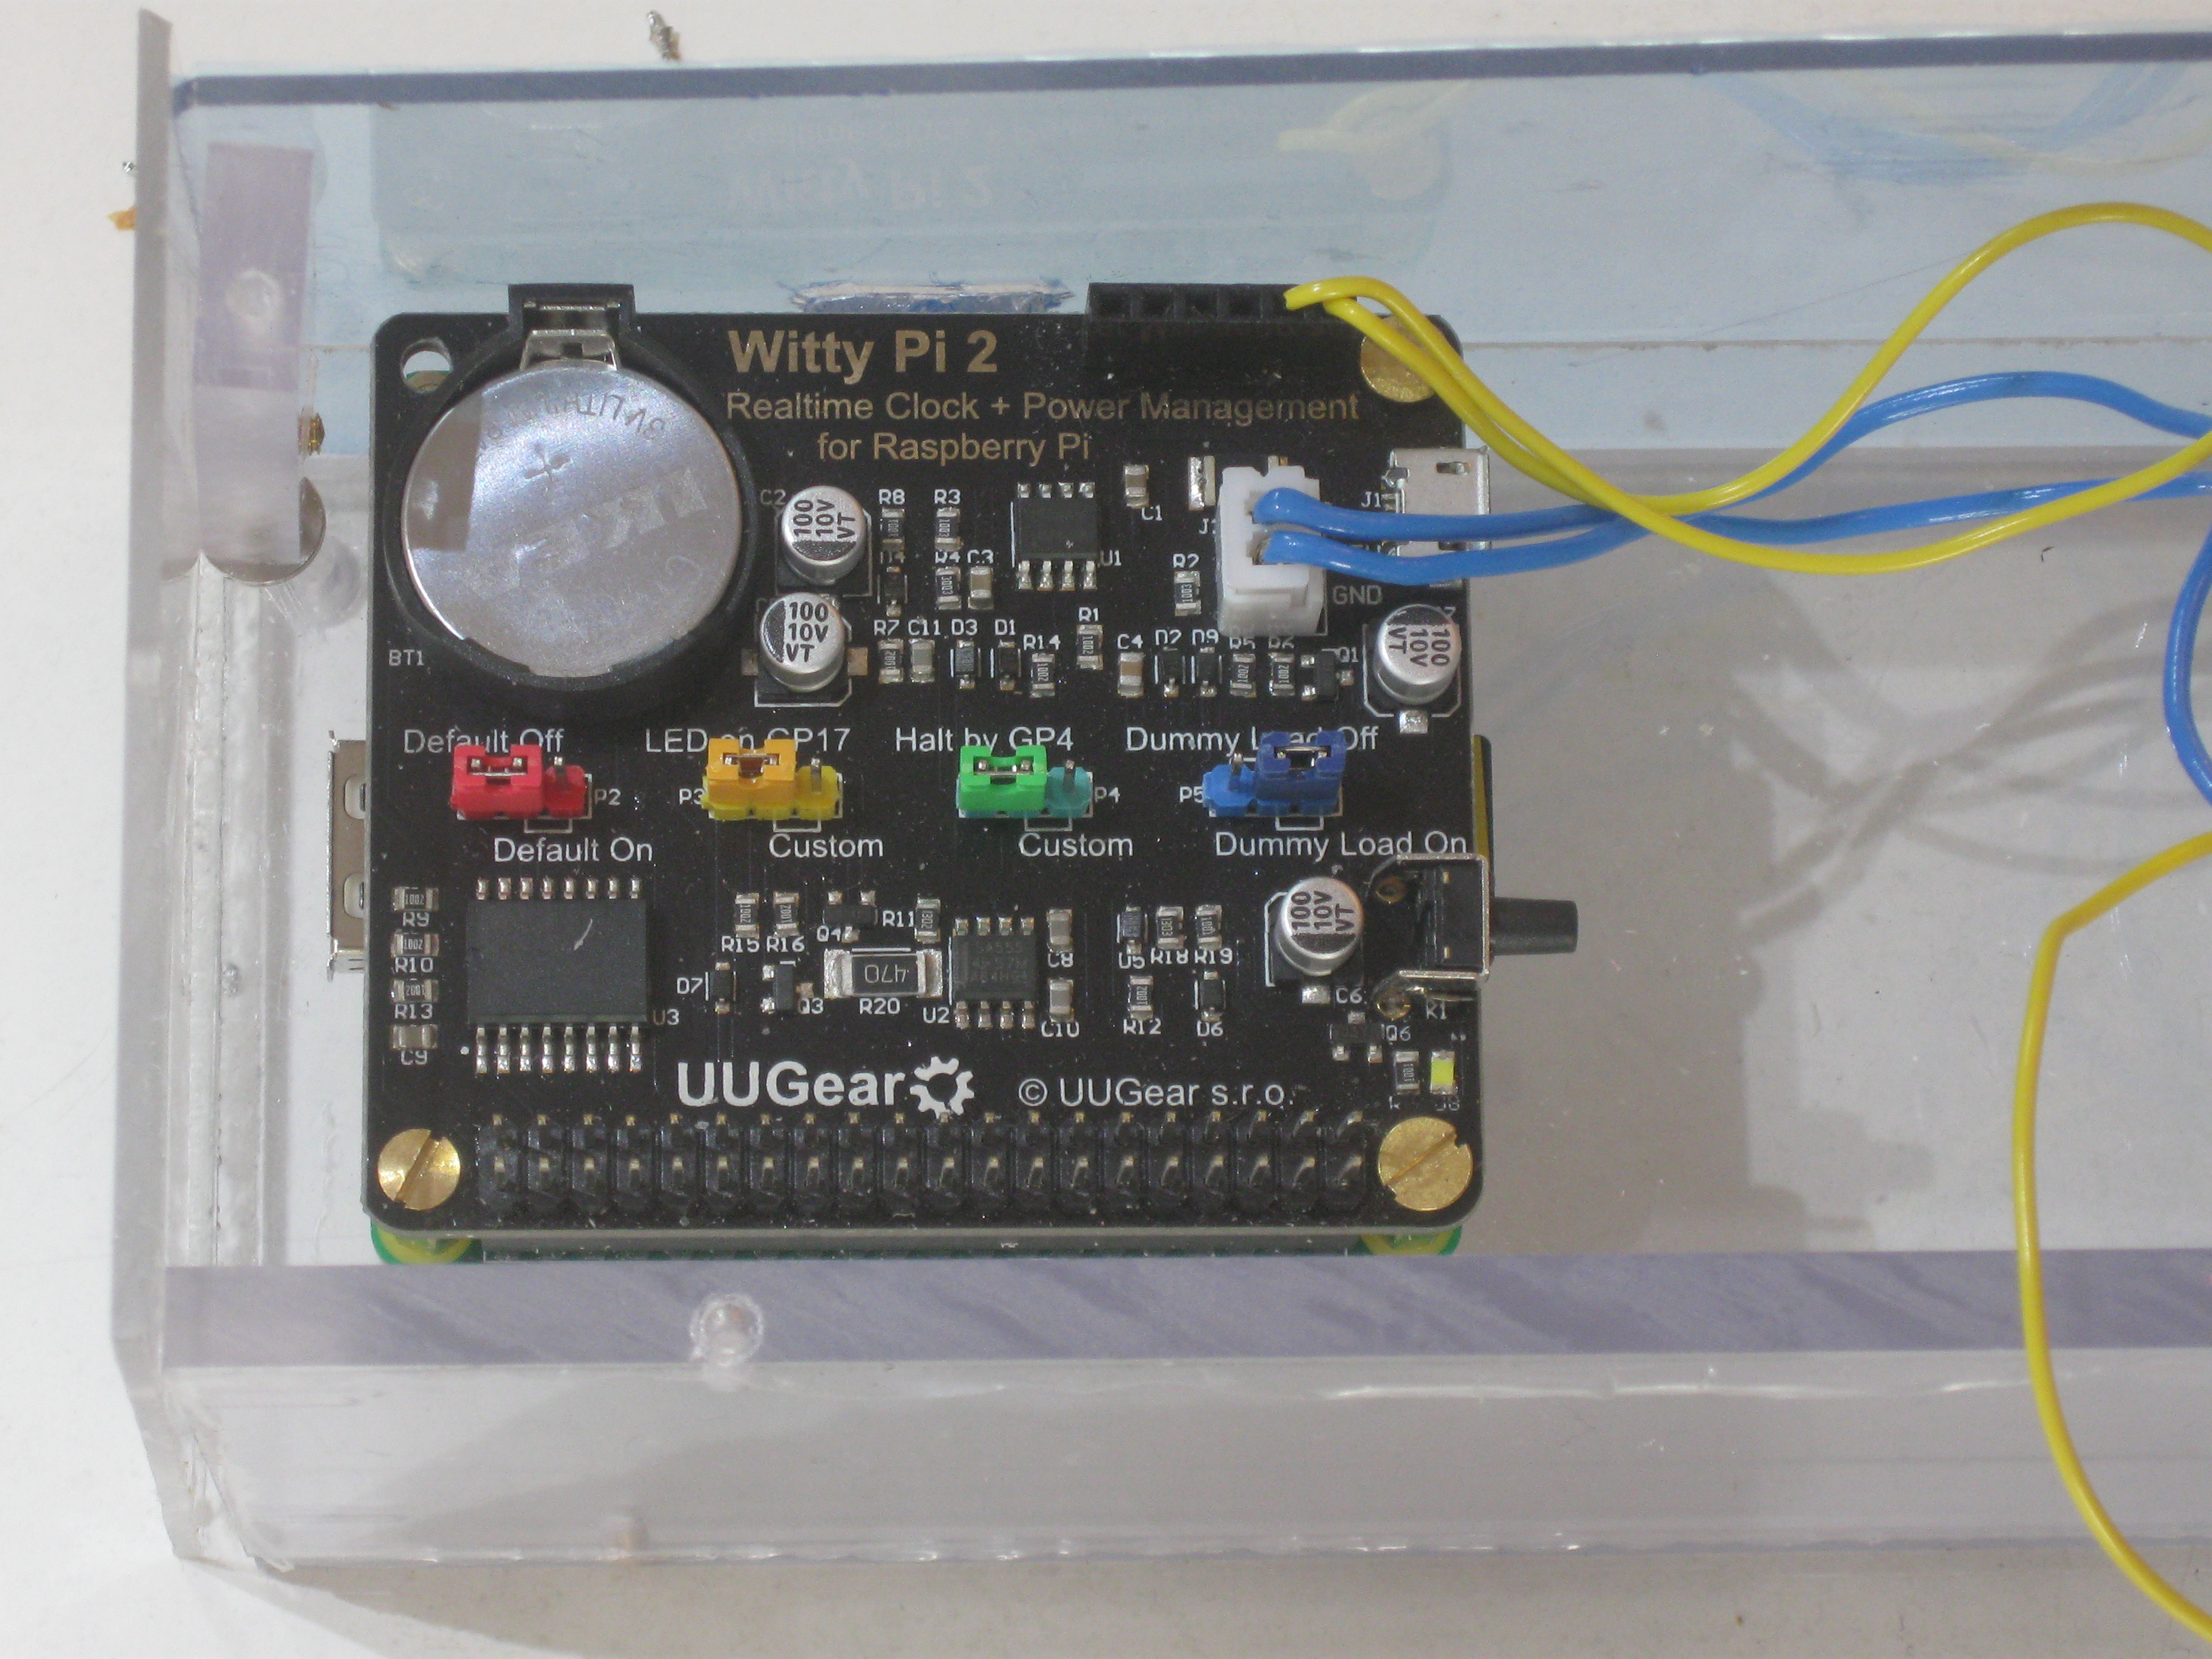
The Witty Pi mounts above the Raspberry Pi model A+ and has a small battery to retain time and alarm settings for the real time clock. Whilst power is off, the Witty Pi draws a small current for a few seconds to keep the main battery on (once demand falls to zero standby batteries utrn themselves off). Power from the main battery is provided via the blue wires and is supplied to the Raspberry Pi as and when required: it is turned on when the real time clock alarm operates and it is turned off under software control from the Raspberry Pi.
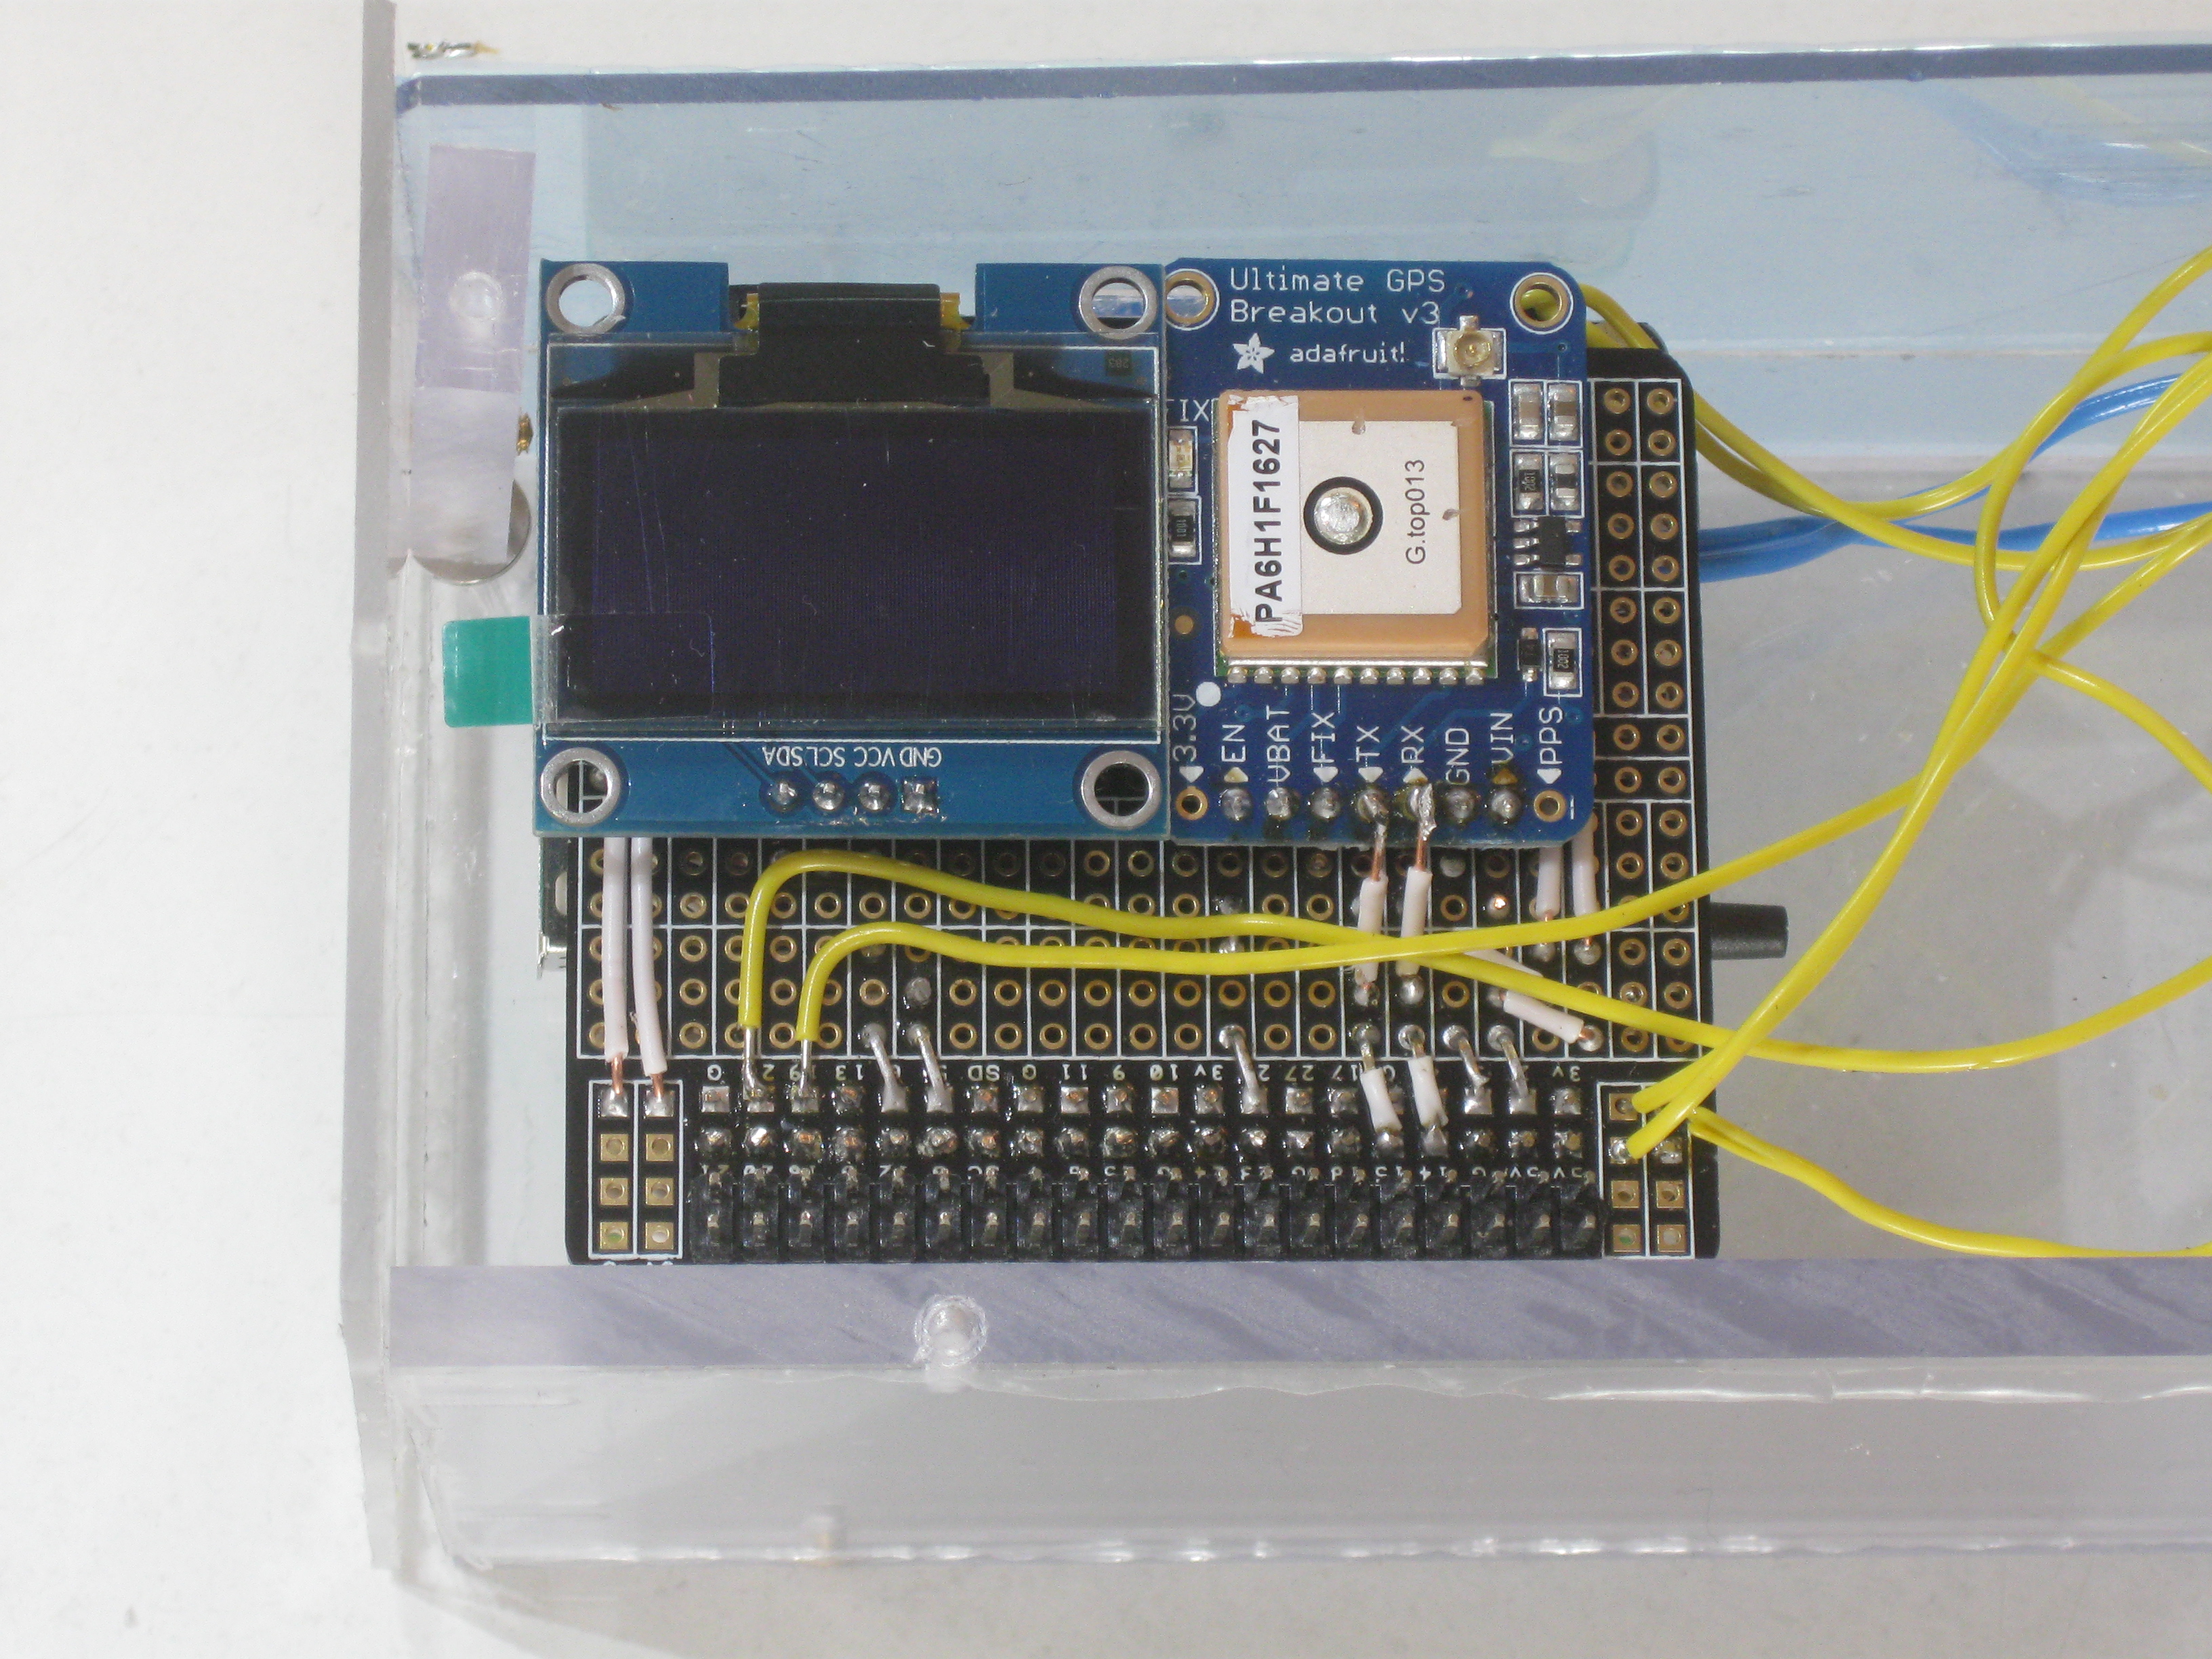
The breakout board allows an OLED display to be fitted, a GPS module to be fitted and a PaPiRus display to be fitted.
The last development step is to optimise the power on time and the power off time to get a good balance between battery usage and continuity.
The translation of WGS84 latitude and longitude to OSGB36 grid reference is somewhat complicated - see below:
17670DEFPROCinitGB
17680REM Initialisation of constants for transformation
17690REM of latitude and longitude from WGS84 to OSGB36
17700_a = 6378137:REM             // WGS84 axis
17710_e = 0.00669438037928458:REM // WGS84 eccentric
17720_a2=6377563.396:REM          // OSGB axis
17730_e2=0.0066705397616:REM      // OSGB eccentric
17740_xp = -446.448:REM           // xp
17750_yp = 125.157:REM            // yp
17760_zp = -542.06:REM            // zp
17770_xr = -0.1502:REM            // xr
17780_yr = -0.247:REM             // yr
17790_zr = -0.8421:REM            // zr
17800_s = 20.4894:REM             // s
17810REM Initialsiation of constants for OSGB conversion
17820a = 6377563.396:REM       // OSGB semi-major
17830b = 6356256.91 :REM       // OSGB semi-minor
17840e0 = 400000:REM           // OSGB easting of false origin
17850n0 = -100000:REM          // OSGB northing of false origin
17860f0 = 0.9996012717:REM     // OSGB scale factor on central meridian
17870e2 = 0.0066705397616:REM  // OSGB eccentricity squared
17880lam0 = -0.034906585039886591:REM // OSGB false east
17890phi0 = 0.85521133347722145:REM   // OSGB false north
17900af0=a*f0
17910bf0=b*f0
17920ENDPROC
17930:
17940DEFPROCconv(long,lat)
17950rlat=lat*PI/180
17960rlon=long*PI/180
17970h=0
17980sf = _s * 0.000001
18000v = _a / SQR(1 - (_e * SIN(rlat) * SIN(rlat)))
18020x = (v + h) * COS(rlat) * COS(rlon)
18040y = (v + h) * COS(rlat) * SIN(rlon)
18060z = ((1 - _e) * v + h) * SIN(rlat)
18070xrot = (_xr / 3600) * PI/180
18080yrot = (_yr / 3600) * PI/180
18090zrot = (_zr / 3600) * PI/180
18100hx = x + (x * sf) - (y * zrot) + (z * yrot) + _xp
18110hy = (x * zrot) + y + (y * sf) - (z * xrot) + _yp
18120hz = (-1 * x * yrot) + (y * xrot) + z + (z * sf) + _zp
18140Nlon = ATN(hy / hx)
18160p = SQR((hx * hx) + (hy * hy))
18180Nlat = ATN(hz / (p * (1 - _e2)))
18190v = _a2 / SQR(1 - _e2 * SIN(Nlat)*SIN(Nlat))
18200errvalue = 1.0
18220WHILE errvalue > 0.001
18230  lat0=ATN((hz + _e2 * v * SIN(Nlat)) / p)
18240  errvalue=ABS(lat0-Nlat)
18250  Nlat=lat0
18260ENDWHILE
18270REM Nlat,Nlon are new lat,long in radians
18280phi = Nlat
18290lam = Nlon
18300REM Easting:
18310slat2=SIN(phi)*SIN(phi)
18320nu=af0/SQR(1-(e2*slat2))
18330rho=nu*(1-e2)/(1-(e2*slat2))
18340eta2=(nu/rho)-1
18350p=lam-lam0
18360IV=nu*COS(phi)
18370clat3=COS(phi)*COS(phi)*COS(phi)
18380tlat2=TAN(phi)*TAN(phi)
18390V=(nu/6)*clat3*((nu/rho)-tlat2)
18400clat5=COS(phi)*COS(phi)*COS(phi)*COS(phi)*COS(phi)
18410tlat4=TAN(phi)*TAN(phi)*TAN(phi)*TAN(phi)
18420VI=(nu/120)*clat5*((5-(18*tlat2)) + tlat4 + (14*eta2) - (58*tlat2*eta2))
18430xgrid=e0+(p*IV)+(p*p*p*V)+(p*p*p*p*p*VI)
18440REM Northing:
18450n=(af0-bf0)/(af0+bf0)
18460M=bf0*(((1+n+((5/4)*(n*n))+((5/4)*(n*n*n)))*(phi-phi0))-(((3*n)+(3*(n*n))+((21/8)*(n*n*n)))*
      (SIN(phi-phi0))*(COS(phi+phi0)))+((((15/8)*(n*n))+((15/8)*(n*n*n)))*(SIN(2*(phi - phi0)))*
      (COS(2*(phi+phi0))))-(((35/24)*(n*n*n))*(SIN(3*(phi-phi0)))*(COS(3*(phi+phi0)))))
18470I=M+n0
18480II=(nu/2)*SIN(phi)*COS(phi)
18490III=((nu/24)*SIN(phi)*COS(phi)*COS(phi)*COS(phi))*(5-TAN(phi)*TAN(phi)+(9*eta2))
18500IIIA=((nu/720)*SIN(phi)*clat5)*(61-(58*tlat2)+tlat4)
18510ygrid=I + (p*p*II) + (p*p*p*p*III) + (p*p*p*p*p*p*IIIA)
18520ENDPROC